. 2012 Aug 31;150(5):909-21.
doi: 10.1016/j.cell.2012.07.030.

Glucosylated hydroxymethyluracil, DNA base J, prevents transcriptional readthrough in Leishmania

Affiliations

Glucosylated hydroxymethyluracil, DNA base J, prevents transcriptional readthrough in Leishmania

Henri G A M van Luenen et al. Cell. .

Abstract

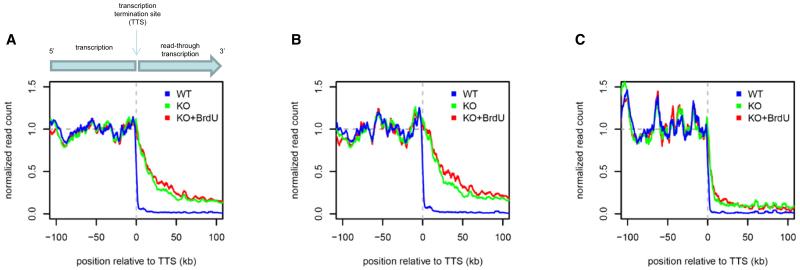
Some Ts in nuclear DNA of trypanosomes and Leishmania are hydroxylated and glucosylated to yield base J (β-D-glucosyl-hydroxymethyluracil). In Leishmania, about 99% of J is located in telomeric repeats. We show here that most of the remaining J is located at chromosome-internal RNA polymerase II termination sites. This internal J and telomeric J can be reduced by a knockout of J-binding protein 2 (JBP2), an enzyme involved in the first step of J biosynthesis. J levels are further reduced by growing Leishmania JBP2 knockout cells in BrdU-containing medium, resulting in cell death. The loss of internal J in JBP2 knockout cells is accompanied by massive readthrough at RNA polymerase II termination sites. The readthrough varies between transcription units but may extend over 100 kb. We conclude that J is required for proper transcription termination and infer that the absence of internal J kills Leishmania by massive readthrough of transcriptional stops.


Figures

Figure 1
Figure 1. Location of Base J in the L. major and L. tarentolae Genomes
(A–D) The location of base J in the L. major (A–C) and L. tarentolae (D) genomes was mapped by deep sequencing. DNA fragments enriched for J were isolated by either an immunoprecipitation with anti-J-DNA antibodies or by a pull-down with JBP1, sequenced, and mapped. As an example, we show the location of J on chromosome 14 of L. major (A) and L. tarentolae (D). All L. major and L. tarentolae chromosomes are presented in Data S1. The upper row in (A) shows the genomic map of L. major chromosome 14 with the blue bars representing the protein coding regions organized in long PTUs encoded by the top (transcription to the right) or bottom strand (transcription to the left). The arrows indicate the transcriptional orientation of the PTUs. The green bars represent RNA genes. The next row shows the DNA segments immunoprecipitated with an antiserum against acetylated histone H3 (Thomas et al., 2009), marking putative transcription start sites. Underneath are two rows showing the localization and abundance (as the total number of reads within 100 bp consecutive bins) of J-containing fragments over the entire chromosome by deep sequencing using either anti-J-DNA antiserum or Strep(II)-tagged JBP1 to enrich for J-containing DNA fragments. Red bars indicate values going off-scale. (B) shows an example of an internal J peak between two histone H3ac peaks in a divergent transcription start region on chromosome 7 of L. major, and (C) shows an internal J peak upstream of a histone H3ac peak within a PTU on chromosome 4. (D) shows the genomic organization of L. tarentolae chromosome 14 and the localization and abundance of base J (using anti-J-DNA antiserum). See also Data S1 and Tables S1 and S2.
Figure 2
Figure 2. Loss of J in L. tarentolae Leads to Transcriptional Readthrough
The location of protein coding units, RNA genes, the direction of transcription of the PTUs, and the location and abundance of base J on chromosome 30 of L. tarentolae are presented as in Figure 1. Bars going up indicate the number of transcripts derived from the top strand; bars going down indicate the number of transcripts derived from the bottom strand. J levels and small RNAs are plotted on a linear scale in bins of 100 bp, and the levels of processed RNAs are plotted on a logarithmic scale also in bins of 100 bp. Red bars are off-scale. The broken vertical line marks the transcription start and stop sites. The RNA samples were normalized by the total number of reads in each library. Data S2 presents the results for all L. tarentolae chromosomes. See also Data S2 and Tables S1 and S2.
Figure 3
Figure 3. Transcription Readthrough upon Loss of JBP2
(A) Average PTU readthrough in JBP2−/− (KO, green) and JBP2−/− grown in the presence of BrdU (KO+BrdU, red) as compared to WT (blue). Curves show running means of small RNA read counts across the transcription termination sites for all convergent PTUs, aligned by their stop sites, taking transcript orientation into account. Negative x axis coordinates represent positions upstream of the stop site within the PTUs, and positive coordinates are downstream of the stop site. The median read density within each PTU was adjusted to unity; hence, downstream transcription levels are values relative to intra-PTU levels. (B and C) The presence of oppositely oriented RNAP III genes in the convergent transcription termination regions drastically decreases readthrough. Similar plots as in (A), but now only for PTUs without RNAP III genes in corresponding convergent transcription termination regions or with RNAP III genes in the corresponding convergent transcription termination regions on the same strand as the upstream PTU (B) and for PTUs with RNAP III genes in the corresponding convergent transcription termination regions on the opposite strand (C). See also Figure S1.
Figure 4
Figure 4. Transcriptional Readthrough of Individual RNAP II Termination Sites at Convergent Transcription Termination Regions
(A) Antisense reads mapping adjacent to convergent transcription termination regions. The number of antisense reads of small RNA mapping to the 20 kb window (or less for shorter PTUs) upstream (left side) or downstream (right side) of the convergent termination site was divided by the window length (in kb) and expressed per million reads for each small RNA-seq library of WT, KO, and KO+BrdU cultures. The convergent transcription termination regions are clustered in four groups with RNAP III genes in the convergent termination region on both strands (T and B), on the top stand only (T), on the bottom strand only (B), or with no RNA genes. Each row represents one transcription termination region. Arrows at the top of bars indicate values that are off-scale. The numbers in the middle refer to the detailed maps of the termination regions listed in Table S4. (B) The ratio of antisense to sense reads from the small RNA-seq libraries adjacent to the convergent transcription termination sites. This analysis uses the same windows and symbols as in (A). See also Tables S3 and S4.
Figure 5
Figure 5. Location of J and Small RNAs on Chromosome 28, which Contains the Only Convergent Transcription Termination Region without J in WT L. tarentolae
The presentation of protein coding regions and J location is as in Figure 1. The small RNA sequence data are shown by vertical bars whose ends represents the fraction of top-strand (values between 0 and 1) and bottom-strand (values between 0 and −1) reads in bins of 100 bp across the chromosome. The total number of reads in each bin is indicated by the color of the bar, with warmer (i.e. redder) colors representing more reads per bin. See Data S2 for a quantitative presentation of sense and antisense RNA.
Figure 6
Figure 6. Effects of Knocking Out the JBP2 Gene and Growth in BrdU of L. tarentolae on Antisense Transcript Levels
(A–C) Antisense transcripts due to premature starts or readthrough were quantified in WT, KO, and KO+BrdU cells. (A) shows a schematic representation of the antisense quantification due to false starts (left side) or readthrough (right side). Normal (WT) transcription of the PTUs (blue bars) is indicated by the black arrows; when base J is lost, J transcription initiation or termination is compromised, leading to transcripts starting upstream of the PTU or continuing downstream of the PTU, as indicated by the red arrows. This is detected as antisense RNA in the PTU on the other side of the transcription start site (false starts) or transcription termination site (readthrough). The antisense SL or small RNA mapped to the first or last 5 kb of the PTU on the other side of the transcription termination site is used to measure, respectively, premature starts or readthrough (dashed red arrows). (B) shows the transcript levels of antisense RNA based on SL RNA-seq and (C) on small RNA-seq (the combined values of three independent experiments). Read densities are expressed per kb normalized to one million reads. The first block of bars in (B) and (C) represents the mean antisense read density over the entire PTU for all 183 PTUs. The effect of false starts is represented as the mean antisense RNA read density in the first 5 kb of all PTUs next to a divergent transcription start site (second block) or of all 22 PTUs next to a divergent start site with a major J peak (third block). The fourth block is the mean antisense RNA read density from the last (3′) 5 kb of all PTUs around a transcription stop site. The fifth block represents the mean antisense RNA read density from the last (3′) 5 kb of the 50 PTUs contiguous with convergent transcription termination regions lacking RNAP III transcribed genes. The antisense reads in the WT samples are in part derived from the authentic readthrough of the J-less convergent transcription termination region on chromosome 28 (see Figures 4 and 5) and in part from incidental antisense transcripts, probably due to mapping errors not yet corrected in the L. tarentolae genome. See also Table S5.

Similar articles

Cited by

References

    1. Agabian N. Trans splicing of nuclear pre-mRNAs. Cell. 1990;61:1157–1160. - PubMed
    1. Armour CD, Castle JC, Chen R, Babak T, Loerch P, Jackson S, Shah JK, Dey J, Rohl CA, Johnson JM, Raymond CK. Digital transcriptome profiling using selective hexamer priming for cDNA synthesis. Nat. Methods. 2009;6:647–649. - PubMed
    1. Beisel C, Paro R. Silencing chromatin: comparing modes and mechanisms. Nat. Rev. Genet. 2011;12:123–135. - PubMed
    1. Belli SI, Monnerat S, Schaff C, Masina S, Noll T, Myler PJ, Stuart K, Fasel N. Sense and antisense transcripts in the histone H1 (HIS-1) locus of Leishmania major. Int. J. Parasitol. 2003;33:965–975. - PubMed
    1. Berriman M, Ghedin E, Hertz-Fowler C, Blandin G, Renauld H, Bartholomeu DC, Lennard NJ, Caler E, Hamlin NE, Haas B, et al. The genome of the African trypanosome Trypanosoma brucei. Science. 2005;309:416–422. - PubMed

Publication types

MeSH terms

Associated data