. 2012 Aug 31;150(5):975-86.
doi: 10.1016/j.cell.2012.07.022.

Lis1 acts as a "clutch" between the ATPase and microtubule-binding domains of the dynein motor

Affiliations

Lis1 acts as a "clutch" between the ATPase and microtubule-binding domains of the dynein motor

Julie Huang et al. Cell. .

Abstract

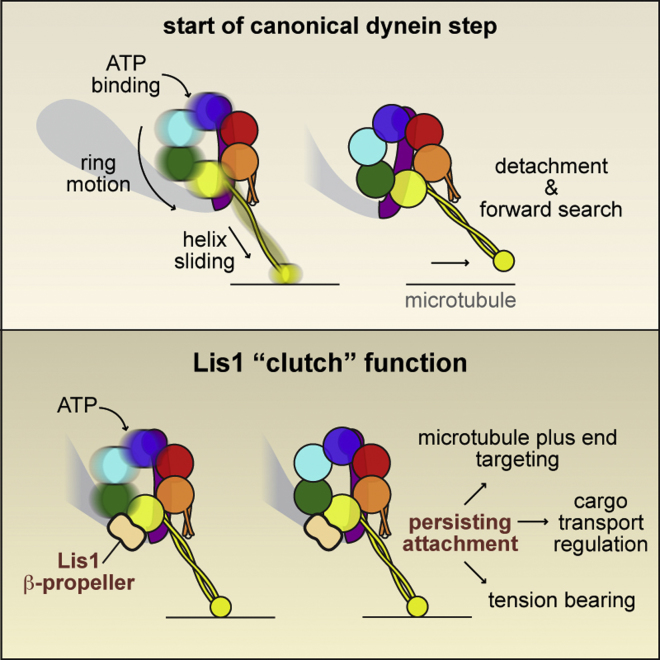
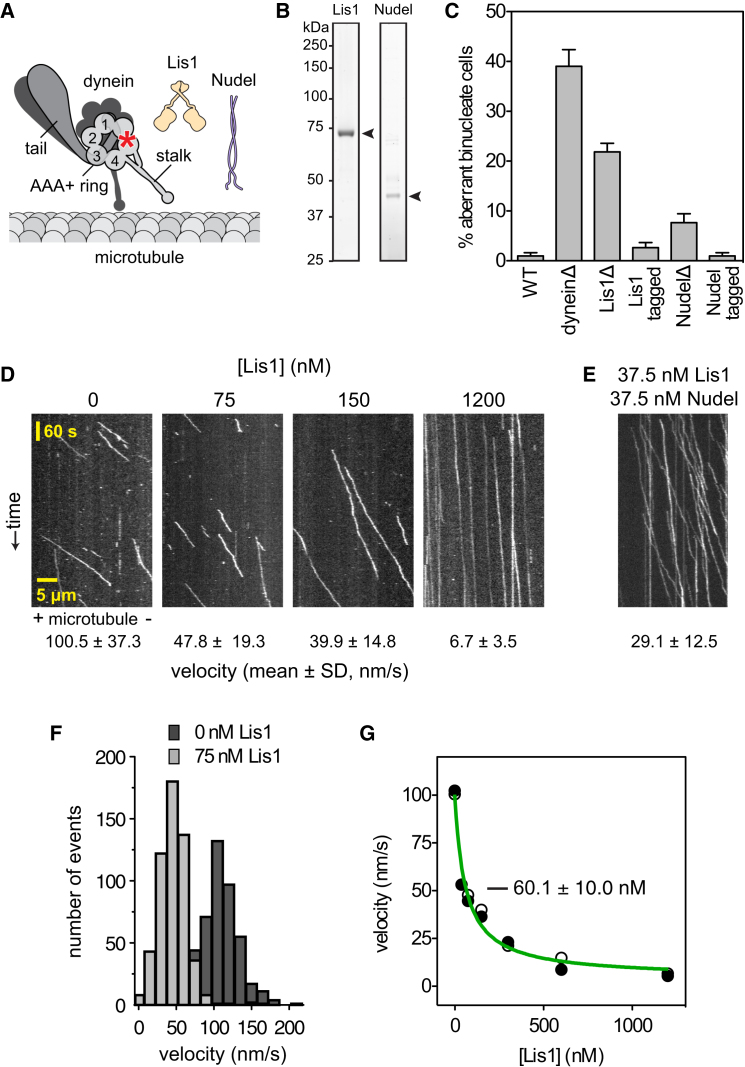
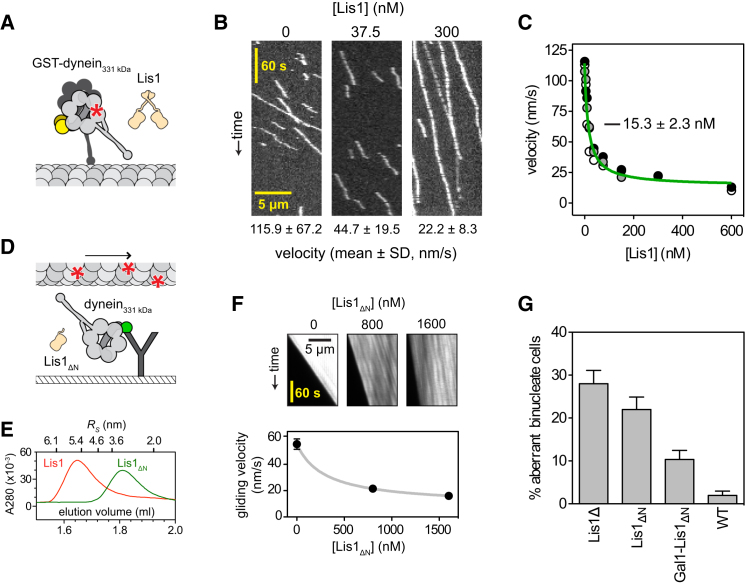
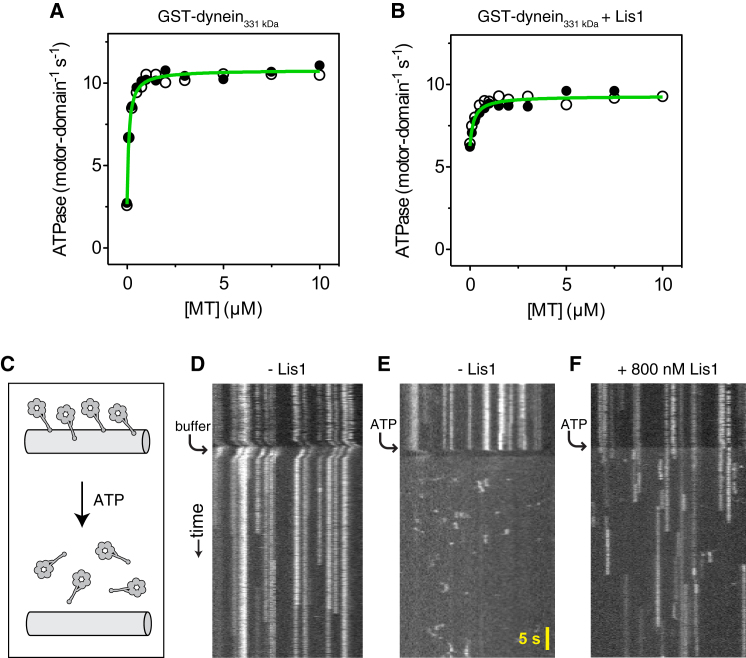
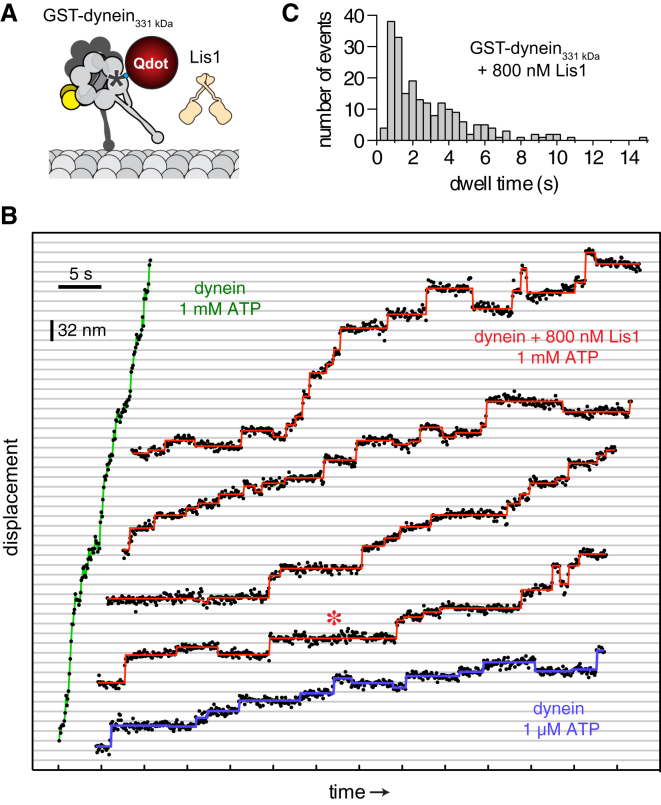
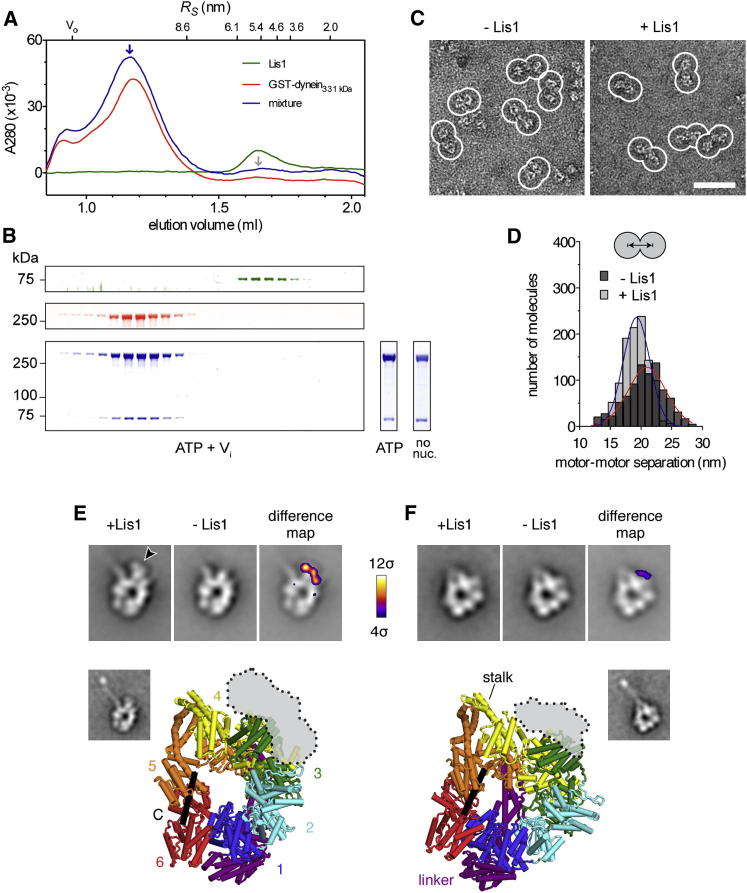
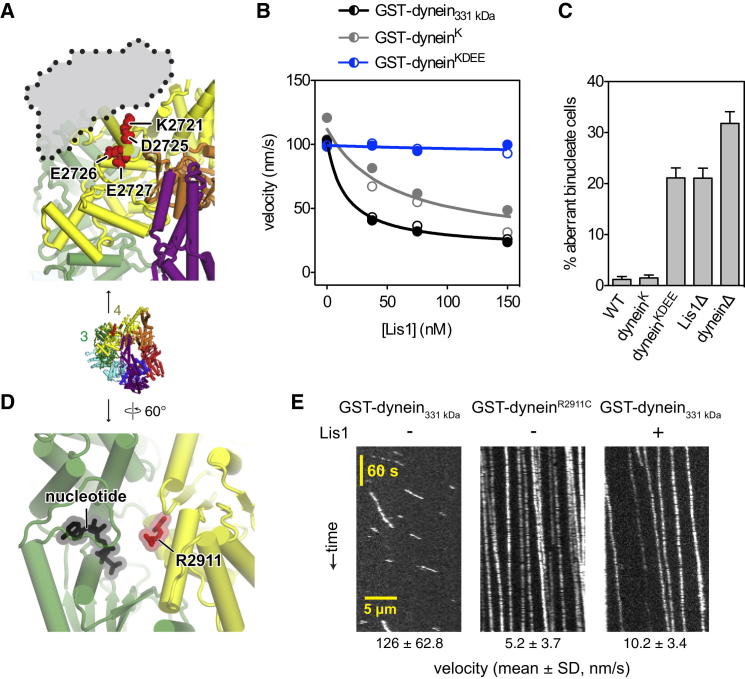
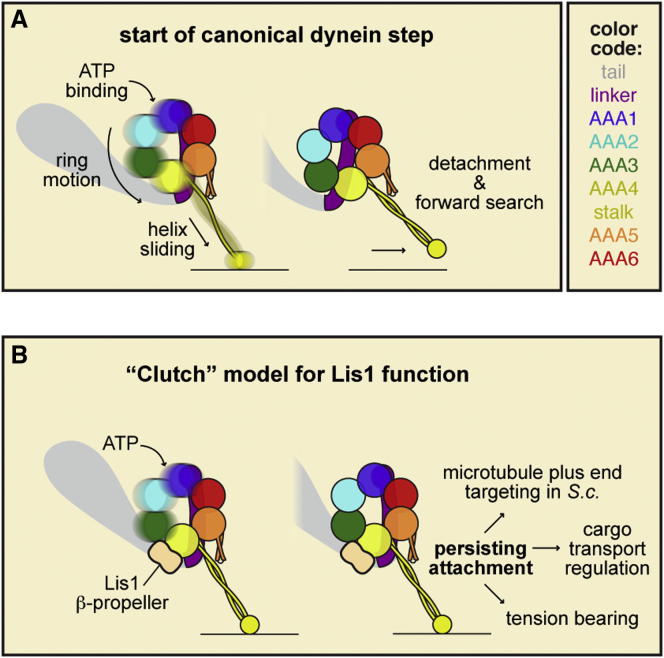
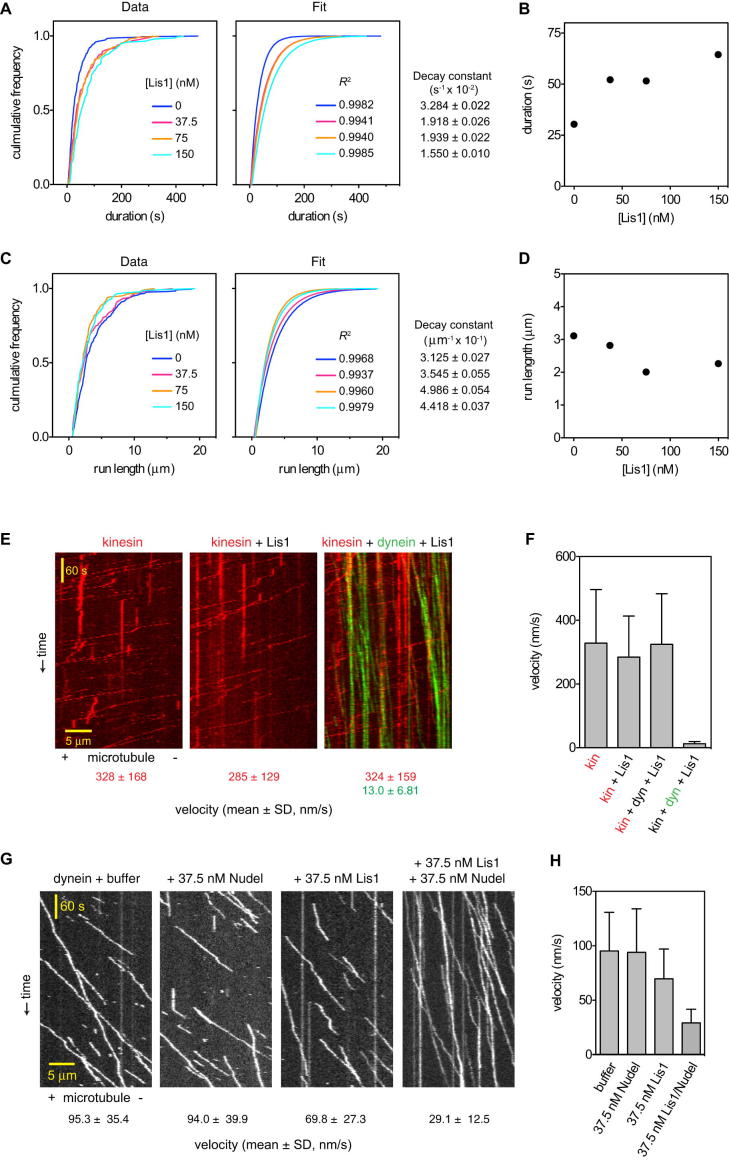
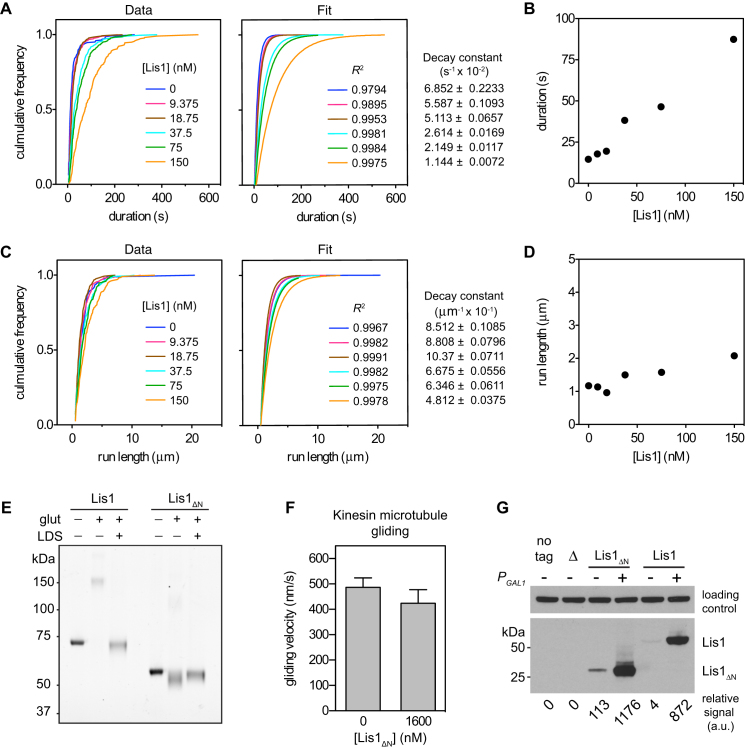
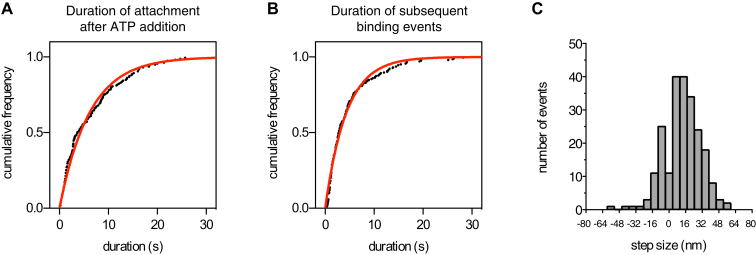
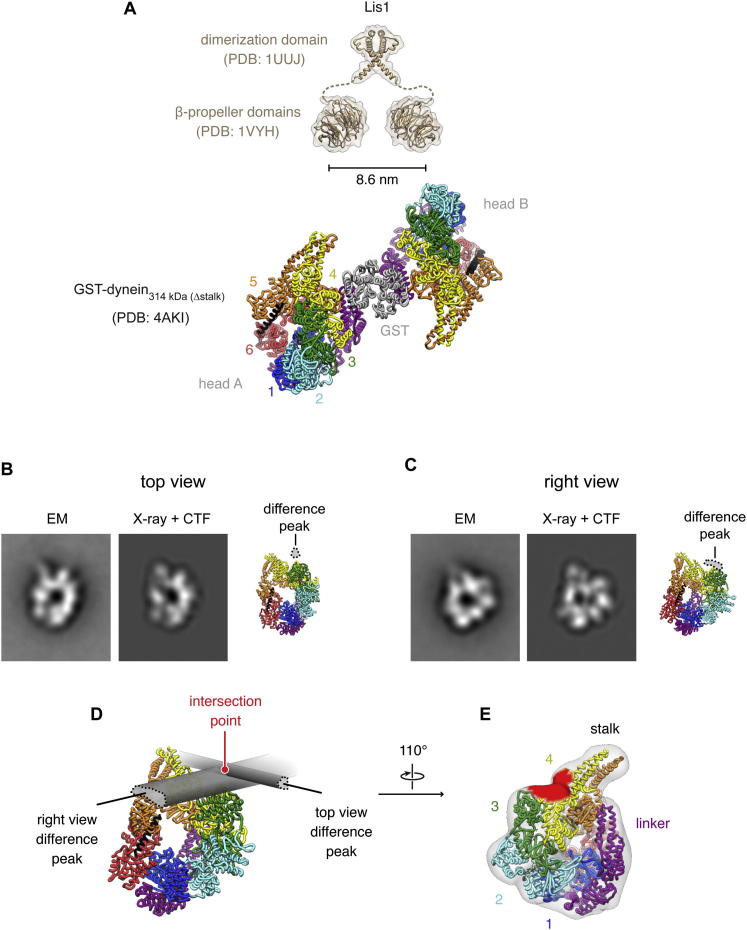
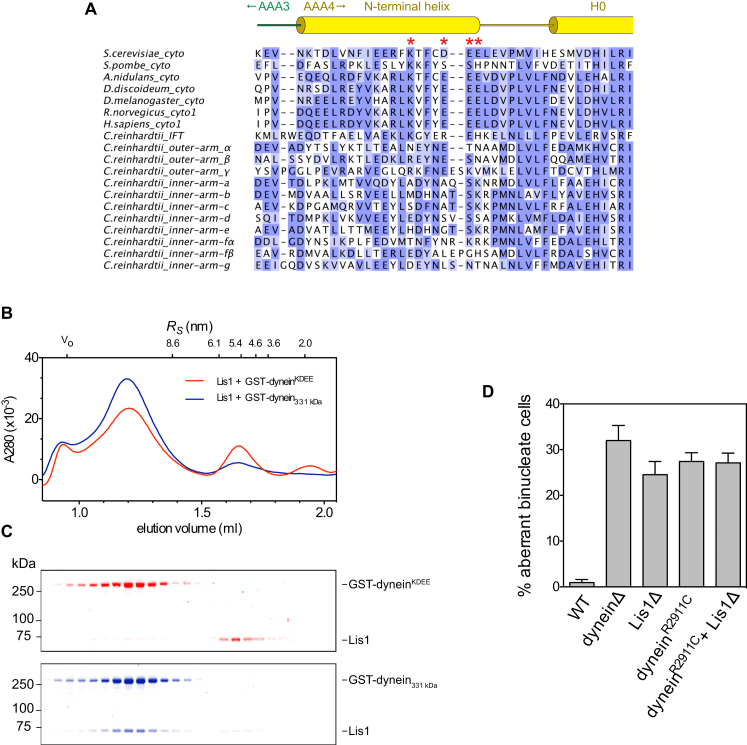
The lissencephaly protein Lis1 has been reported to regulate the mechanical behavior of cytoplasmic dynein, the primary minus-end-directed microtubule motor. However, the regulatory mechanism remains poorly understood. Here, we address this issue using purified proteins from Saccharomyces cerevisiae and a combination of techniques, including single-molecule imaging and single-particle electron microscopy. We show that rather than binding to the main ATPase site within dynein's AAA+ ring or its microtubule-binding stalk directly, Lis1 engages the interface between these elements. Lis1 causes individual dynein motors to remain attached to microtubules for extended periods, even during cycles of ATP hydrolysis that would canonically induce detachment. Thus, Lis1 operates like a "clutch" that prevents dynein's ATPase domain from transmitting a detachment signal to its track-binding domain. We discuss how these findings provide a conserved mechanism for dynein functions in living cells that require prolonged microtubule attachments.


Figures

None
Graphical abstract
Figure 1
Figure 1
Impact of Lis1 on Single Dynein Molecule Motility (A) Diagram of dynein, Lis1, and Nudel constructs. The C terminus of dynein's heavy chain is tagged with a HaloTag and covalently bound to tetramethylrhodamine (TMR; red asterisk). (B) Purification of yeast Lis1 and Nudel. Lis1 and Nudel were isolated from S. cerevisiae using affinity purification tags followed by removal of tags by TEV protease cleavage. SDS-PAGE shows Lis1 and Nudel after the final purification step. Arrowheads indicate Lis1 and Nudel protein. (C) C-terminal SNAP tags on Lis1 and Nudel do not affect their nuclear segregation function in vivo. Cells expressing Lis1 or Nudel modified with the SNAP tag (tagged) have near-WT levels of aberrant binucleate cells. The mean and SE of proportion are shown (n > 206 per data point). (D) Kymographs of TMR-labeled dynein molecules moving along microtubules over time in the presence of increasing concentrations of Lis1. Plus (+) and minus (−) indicate microtubule polarity. The mean velocity for each condition is shown below (n > 100 per data point). For average durations of microtubule association and average run lengths as a function of Lis1 concentration, see Figures S1A–S1D. The effect of Lis1 on kinesin motility is shown in Figures S1E and S1F. (E) Kymograph of TMR-labeled dynein molecules in the presence of 37.5 nM Lis1 and 37.5 nM Nudel, with mean velocity below (n = 217). Time and distance scales are as in (D). Additional quantification is shown in Figures S1G and S1H. (F) Histogram showing the velocity distribution of single dynein molecules in the absence of Lis1 (dark gray; n = 498) and at one example Lis1 concentration (75 nM; light gray; n = 539). At all Lis1 concentrations tested (37.5, 75, 150, 300, 600, and 1,200 nM), the dynein velocity distribution was unimodal and could be well fit by a single Gaussian (R2 values between 0.8448 and 0.9894; data not shown). (G) Plot of dynein velocity as a function of Lis1 concentration. Data points from two independent dynein preparations are shown (black and white circles; n > 100 per data point). Data were fit to the following equation: V = V0 (1 − [(Fmax[Lis1]) / (K1/2 + [Lis1])]), in which V = velocity at a given Lis1 concentration, [Lis1]; V0 = velocity of dynein in the absence of Lis1; Fmax = maximal fractional velocity reduction; and K1/2 = [Lis1] required for half maximal velocity reduction. The best-fit values (±error of the fit) are V0 = 100.0 ± 3.506 nm/s, Fmax = 0.957 ± 0.031, and K1/2 = 60.1 ± 10.0 nM. The R2 value is 0.9797. See also Table S2A.
Figure 2
Figure 2
Defining Structural Domains Required for Motility Regulation by Lis1 (A) Diagram of GST-dynein331 kDa and Lis1 constructs. The GST dimerization domain is shown in yellow, and the C terminus is tagged with a HaloTag and covalently bound to TMR (red asterisk). (B) Kymographs of TMR-labeled GST-dynein331 kDa molecules in the presence of increasing concentrations of Lis1. The mean velocity for each condition is shown below (n > 200 per data point). See also Table S2B. For average durations of microtubule association and average run lengths as a function of Lis1 concentration, see also Figures S2A–S2D. (C) Plot of GST-dynein331 kDa velocities as a function of Lis1 concentration. Data points from three independent dynein preparations are shown (black, gray, and white circles; n > 104 per data point). Data were fit as described in Figure 1G (R2 = 0.9652; V0 = 114.4 ± 3.531 nm/s, Fmax = 0.877 ± 0.025, and K1/2 = 15.3 ± 2.3 nM). (D) Diagram of microtubule gliding assay. Monomeric GFP-dynein331 kDa molecules are immobilized to the coverslip via antibodies to GFP (green). Dynein-driven gliding of microtubules (labeled with TMR; red asterisks) is visualized in the presence or absence of monomeric Lis1 (Lis1ΔN). (E) Elution profiles of dimeric Lis1 (red) and monomeric Lis1ΔN (green) from a size-exclusion column. Elution volumes of standards with known Stokes radii (RS) are shown above. The calculated Stokes radii of dimeric Lis1 and Lis1ΔN are 5.3 nm and 3.3 nm, respectively. See also Figure S2E. (F) Upper: kymographs of taxol-stabilized microtubules moving via dynein-dependent gliding in the presence of increasing amounts of Lis1ΔN. Kymographs show one end of the microtubule. Lower: plot of mean velocities (±SD; n = 10–21) fit as described in Figure 1G (R2 = 0.9742; V0 = 55.48 ± 0.6759 nm/s, Fmax = 0.814 ± 0.059, and K1/2 = 299.1 ± 97.1 nM). The effect of Lis1ΔN on kinesin-dependent microtubule gliding is shown in Figure S2F. (G) Overexpression of Lis1ΔN (Gal1-Lis1ΔN) partially rescues the aberrant binucleate phenotype of S. cerevisiae cells lacking Lis1 (Lis1Δ). Cells expressing dimeric Lis1 (WT) or monomeric Lis1 (Lis1ΔN) under the control of the endogenous Lis1 promoter are as indicated. The mean and SE of proportion are shown (n > 201 per data point). See also Figure S2G.
Figure 3
Figure 3
Lis1-Induced Changes in Dynein Mechanochemistry (A) Microtubule-stimulated ATPase activity of GST-dynein331 kDa in the absence of Lis1. Data points from two dynein preparations are shown (black and white circles). Data were fit to the following equation: kobs = (kcatkbasal) − [MT]/(Km(MT) + [MT]) + kbasal. The basal ATPase rate (kbasal) of 2.7 ± 0.2 motor-domain−1 s−1 (± SE of fit) is activated by microtubules to a maximal rate (kcat) of 10.8 ± 0.5 motor-domain−1 s−1. The Km(MT) is 0.09 ± 0.01 μM (i.e., the microtubule concentration that gives half-maximal activation). (B) Microtubule-stimulated ATPase activity of GST-dynein331 kDa in the presence of 140 nM Lis1. Data points from two dynein preparations are shown (black and white circles). Data were fit as described in (A). The basal ATPase rate of 6.3 ± 0.2 motor-domain−1 s−1 is activated by microtubules to a maximal rate of 9.3 ± 0.1 motor-domain−1 s−1. The Km(MT) is 0.20 ± 0.05 μM. (C) Diagram of the single-molecule microtubule release assay. TMR-labeled monomeric dynein331 kDa molecules are bound to microtubules in the absence of ATP. Perfusion with ATP causes release. (D–F) Kymographs of TMR-labeled dynein331 kDa molecules. After prebinding to microtubules in the absence of ATP, dynein331 kDa-TMR molecules are monitored for release and rebinding upon perfusion of (D) buffer lacking ATP, (E) 5 mM ATP, or (F) 5 mM ATP in the presence of 800 nM Lis1. Similar results were observed using microtubules (data not shown) and axonemal microtubules (shown). See Figures S3A and S3B for quantification of off-rates.
Figure 4
Figure 4
Stepping Behavior of Dynein/Lis1 (A) Diagram of Lis1 and GST-dynein331 kDa labeled at its C terminus with a Qdot. (B) Examples of GST-dynein331 kDa high-precision stepping traces in the presence of 1 μM ATP (blue), 1 mM ATP (green), or 1 mM ATP and 800 nM Lis1 (red). Raw data are shown as black circles. Steps detected by an automated step-finding algorithm (see Extended Experimental Procedures) are depicted with colored lines. The red asterisk highlights an example of a long pause (dwell) by dynein/Lis1. Data were acquired every 100 ms. See also Figure S3C. (C) Histogram showing dwell times between steps by GST-dynein331 kDa in the presence of Lis1, acquired from 209 steps from 10 moving dynein molecules.
Figure 5
Figure 5
Purification and Structure of the Dynein/Lis1 Complex (A) Purification of the dynein/Lis1 complex by size-exclusion chromatography. Traces show the elution profiles of Lis1 (green), GST-dynein331 kDa (red), and a mixture of both proteins (blue) in ATP + Vi buffer conditions. Complex formation is indicated by the coelution of dynein and Lis1 (blue arrow) and depletion of free Lis1 (gray arrow). Elution volumes of standards with known Stokes radii (RS) and the void volume (V0) are shown above. (B) SDS-PAGE of size-exclusion chromatography fractions, colored as in (A). GST-dynein331 kDa and Lis1 coelute in a complex (blue bands) in ATP + Vi buffer conditions (main panel) as well as in ATP and no-nucleotide conditions (lower right: peak fractions). (C) Negative-stain EM images of GST-dynein331 kDa alone (− Lis1) and bound to Lis1 (+ Lis1). Examples of paired motor domains are outlined in white. The scale bar represents 50 nm. (D) Histogram showing motor-motor separation distances for dynein dimers alone (dark gray) or bound to Lis1 (light gray). Each distribution is fit with a Gaussian (R2 values of 0.9443 and 0.9830, respectively). Motor-motor separation of dynein alone is 21.0 ± 0.2 nm (± error of the fit) and the SD is 3.1 ± 0.2 nm (n = 854). In the presence of Lis1, the motor-motor separation is 19.3 ± 0.1 nm and the SD is 2.1 ± 0.1 nm (n = 1067). The motor-motor separation is significantly reduced in the presence of Lis1 (p < 0.0001, Welch t test), and the variation in motor-motor spacing is significantly smaller (p < 0.0001, f test). (E and F) Analysis of the Lis1 binding site on dynein. The two main views of the dynein motor domain following single-particle analysis are shown (top view [E] and right view [F]). In each case, the upper row shows an average of the dynein/Lis1 complex (left panel), dynein alone (middle panel), and the difference map between these images overlaid on the dynein average (right panel). Differences are shown at 4σ above the mean and colored according to the chart. Prominent extra density in the dynein/Lis1 complex is indicated (arrowhead in E). The window width corresponds to 26.4 nm. Lower: the difference peak overlaid on the corresponding view of the yeast dynein motor domain crystal structure (PDB 4AKI; Schmidt et al., 2012), as determined by projection matching (see Figures S4B and S4C). The stalk, linker, AAA+ modules (1–6), and C-terminal region (C) are indicated. Insets show class averages revealing the full length of the stalk and microtubule-binding domain at its tip, which are truncated in the crystal structure.
Figure 6
Figure 6
Mutational Analysis of the Lis1 Binding Site and Intersubunit Communication at AAA3/4 (A) Close-up view of the putative Lis1/dynein interface at AAA3 (green) and AAA4 (yellow). The Lis1 difference peak is shown with a dotted outline, overlaid on the yeast dynein crystal structure (PDB 4AKH; Schmidt et al., 2012). Red spheres depict four highly conserved amino acids (K2721, D2725, E2726, and E2727) chosen for mutagenesis. See also Figure S5A. The entire dynein motor domain is shown in the inset below for reference. (B) Mutation of a single amino acid (K2721E; GST-dyneinK) in the first helix of AAA4 in dynein impairs Lis1-mediated velocity reduction, which is virtually abolished by a quadruple mutation (K2721A, D2725G, E2726S, and E2727G; GST-dyneinKDEE). Data for GST-dynein331 kDa and GST-dyneinK were fit as described in Figure 1G. For GST-dynein331 kDa: R2 = 0.9962; V0 = 102.2 ± 1.681 nm/s, Fmax = 0.825 ± 0.028, and K1/2 = 15.68 ± 2.85 nM. For GST-dyneinK: R2 = 0.9406; V0 = 112.6 ± 6.155 nm/s, Fmax = 0.825 ± 0.068, and K1/2 = 52.18 ± 16.78 nM. Data points from two independent experiments are shown (open and closed circles; n > 203 per data point; see also Table S2C). (C) Quadruple mutation in the first helix of AAA4 causes an aberrant binucleate phenotype highly similar to loss of Lis1 (Lis1Δ). The mean and SE of proportion are shown (n > 405 per data point). WT dynein (WT) and dynein with mutation(s) K2721E (dyneinK) or K2721A, D2725G, E2726S, and E2727G (dyneinKDEE) are indicated. (D) Close-up view of the AAA4 arginine finger (R2911; red sticks) that reaches into the nucleotide-binding pocket of AAA3. Nucleotide (AMP-PNP) bound in AAA3 is shown in black stick representation (PDB 4AKH; Schmidt et al., 2012). (E) Kymographs of single-molecule motility of TMR-labeled GST-dyneinR2911C on microtubules. The mean velocity for each condition is shown below (n > 162). GST-dynein331 kDa motility in the presence of buffer (−) or 600 nM Lis1 (+) is shown for comparison. See Figure S5D for in vivo characterization of the R2911C mutation.
Figure 7
Figure 7
Model for Dynein Motility Regulation by Lis1 (A and B) Model of a canonical dynein step (A) and Lis1-mediated motility regulation (B). See main text for details. For clarity, only one Lis1 β-propeller domain and one dynein heavy chain are shown (both are dimers), and dynein's C-terminal region, which lies on the near face of the ring, is omitted. S.c., S. cerevisiae.
Figure S1
Figure S1
Impact of Lis1 and Nudel on Kinesin and Dynein Motility, Related to Figure 1 (A) Cumulative frequency plots of the duration of dynein's microtubule association at varying Lis1 concentrations (left) and their associated fits to a one-phase exponential decay (right). R2 values and decay constants (± error of the fit) are shown at right and far right, respectively. At Lis1 concentrations exceeding 150 nM, dynein molecules frequently remained attached beyond the last frame of the movie and were thus not included in the analysis. Data were pooled from two independent experiments (n = 125–251 per data point). (B) Plot of the average duration of dynein's microtubule association as a function of Lis1 concentration. SE of the fit for each data point ranges from 0.201 to 0.711 s. (C) Cumulative frequency plots of dynein run length at varying Lis1 concentrations (left) and their associated fits to a one-phase exponential decay (right). R2 values and decay constants (± error of the fit) are shown at right and far right, respectively. Data were pooled from two independent experiments (n = 118–243 per data point). (D) Plot of average run lengths of dynein as a function of Lis1 concentration. SE of the fit for each point ranges from 0.019 to 0.044 μm. Dynein run length does not show a strong dependency on Lis1 concentration, due to two combined effects of Lis1 on dynein motility: although dynein remains attached to the microtubule for longer, its velocity is slower, so there is little change in the average travel distance. (E) Kymographs of GFP-tagged kinesin (red) molecules moving along microtubules over time, either alone or in the presence of 600 nM Lis1 and TMR-labeled dynein (green). Plus (+) and minus (−) indicate microtubule polarity. The mean velocity for each motor is shown below. The human kinesin 1–560 aa (K560) construct was expressed and purified from Escherichia coli as previously described (Case et al., 1997). (F) Mean single molecule velocities from (E). Error bars show SD. The velocity shown corresponds to highlighted motor (n > 141 per data point). (G) Kymographs of TMR-labeled dynein molecules moving on microtubules in the presence and absence of 37.5 nM Lis1 and/or 37.5 nM Nudel. The mean velocity for each condition is shown below. Plus (+) and minus (−) indicate microtubule polarity. (H) Quantification of single dynein molecule velocities (mean ± SD) from (G). Nudel enhances the Lis1-dependent reduction of dynein velocity (n > 216 per data point).
Figure S2
Figure S2
Further Analysis of Dimeric and Monomeric Lis1 Constructs, Related to Figure 2 (A) Cumulative frequency plots of the duration of GST-dynein331 kDa microtubule association in the presence of varying Lis1 concentrations (left) and their associated fits to a one-phase exponential decay (right). R2 values and decay constants (±error of the fit) are shown at right and far right, respectively. Data were pooled from two independent experiments (n = 220–311 per data point). (B) Plot of the average duration of GST-dynein331 kDa microtubule association as a function of Lis1 concentration. SE of the fit for each data point ranges from 0.247 to 0.554 s. (C) Cumulative frequency plots of GST-dynein331 kDa run length at varying Lis1 concentrations (left) and their associated fits to a one-phase exponential decay (right). R2 values and decay constants (± error of the fit) are shown at right and far right, respectively. Data were pooled from two independent experiments (n = 206–286 per data point). (D) Plot of average run lengths of GST-dynein331 kDa as a function of Lis1 concentration. SE of the fit for each point ranges from 0.007 to 0.016 μm. As with full-length dynein (Figure S1D), the GST-dynein331 kDa run length does not show a strong dependency on Lis1 concentration. Although dynein remains attached to the microtubule for a longer time, its velocity is slower, so there is little change in the average travel distance. (E) SDS-PAGE of Lis1 and Lis1ΔN after treatment with the crosslinking reagent glutaraldehyde (glut). Exposure of intact Lis1 to glutaraldehyde produces a covalently crosslinked dimer that migrates about twice the size of the untreated form. As a negative control, pretreatment of Lis1 with LDS (4%) to denature Lis1 abolishes formation of the crosslinked dimer. For the Lis1ΔN construct, no shift to a dimeric form is observed in the presence of glutaraldehyde, indicating that it is monomeric. (F) A high concentration (1600 nM) of Lis1ΔN has little effect on the gliding velocity of taxol-stabilized microtubules driven by kinesin. Error bars represent the SD (n = 40 microtubules in each case). (G) Western blots of cellular extracts from galactose-induced cells expressing ZZ-Lis1ΔN or ZZ-Lis1 under the control of either the galactose-inducible promoter (PGAL1; +) or the endogenous Lis1 promoter (−). Cells lacking Lis1 (Δ) or expressing Lis1 lacking the ZZ-tag used for western detection (no tag) were examined in parallel. Protein expression analysis was performed as described (Huang et al., 2006) using a FastPrep-24 (MP Biomedicals). Clarified samples were loaded onto 4%–12% Tris-Bis protein gels (Invitrogen), blotted to nitrocellulose membrane, and probed with a 1:7500 dilution of peroxidase-conjugated anti-ProteinA (PAP) antibody (Sigma). Chemiluminescence signals were detected with autoradiography film and scanned at 800 dpi using a high-resolution film scanner (Aztek Plateau). Relative signals were quantified using ImageJ (National Institutes of Health). The loading control is a nonspecific band that cross-reacts with the PAP antibody.
Figure S3
Figure S3
Further Characterization of Dynein Behavior in the Presence of Lis1, Related to Figures 3 and 4 (A and B) In the single-molecule microtubule release assay (Figures 3C–3F), perfusion of ATP into the system caused monomeric dynein331 kDa molecules to rapidly dissociate from the microtubule (typically within 1 s of ATP addition). In the presence of Lis1, dynein molecules remain attached for extended periods. (A) A cumulative frequency plot of the duration of dynein331 kDa-microtubule attachments after the addition of ATP. Data points (black) are fit by a one-phase exponential decay (red), with a decay constant of 0.162 ± 0.002 s−1 (± error of the fit). The R2 value is 0.9855. (B) A cumulative frequency plot of the durations of subsequent rebinding events of dynein331 kDa to the microtubule in the presence of ATP and Lis1. The data are fit by a one-phase exponential decay with a decay constant of 0.230 ± 0.002 s−1. The R2 value is 0.9887. (C) In high-precision Qdot stepping experiments, step sizes of GST-dynein331 kDa in the presence of 800 nM Lis1 and 1 mM ATP could be measured. The 1D step size distribution is similar to that previously reported for GST-dynein331 kDa alone in rate-limiting (10 μM) ATP conditions (Reck-Peterson et al., 2006). The probability of back stepping is also the same (0.2) in the presence or absence of Lis1. The histogram includes 223 steps from 10 moving dynein molecules.
Figure S4
Figure S4
Comparison of EM Data with Dynein and Lis1 Crystal Structures, Related to Figure 5 (A) Crystal structures of Lis1's dimerization domain (PDB 1UUJ; Kim et al., 2004) and β-propeller domains (PDB 1VYH; Tarricone et al., 2004) shown to scale with respect to the crystallized GST-dynein314 kDa (Δstalk) dimer (PDB 4AKI; Schmidt et al., 2012). The 17 amino acids unresolved in the Lis1 crystal structures are represented with dashed lines. Lis1's dimerization domain is shown in the putative “open scissor” conformation (Kim et al., 2004; Tarricone et al., 2004). The two dynein heads, dimerized by GST, are indicated. Lis1's β-propeller domains are in principle capable of spanning the two dynein motor domains in this construct. Whether this can occur when dynein is microtubule-bound is unknown. (B and C) Cross correlation was used to determine orientations of the yeast dynein motor domain X-ray structure (PDB 4AKI; Schmidt et al., 2012) corresponding to the two main views of the motor seen by EM. The X-ray structure was Fourier transformed, treated with a contrast transfer function to simulate the imaging conditions in the EM experiment, back-transformed, and projected at evenly spaced angular intervals (3° between projections). The projections were then aligned to the EM averages (left panels). For each view, the best scoring projection (middle panels) and a corresponding cartoon representation of the X-ray structure (right panels) are shown. Based on the analysis in Figure 5, the difference peaks corresponding to the additional density in the presence of Lis1 are overlaid in each view (dotted outlines). (D) When the Lis1 difference peaks from the two views are combined (effectively bringing the right panels in [B] and [C] into mutual register), they are consistent (i.e., they intersect in three dimensions). The intersection point indicates the approximate 3D position of Lis1 with respect to dynein suggested by this analysis. (E) View of the dynein motor domain, with regions within 25 Å of the intersection point colored in red (25 Å is the radius of the Lis1 β-propeller domain). This putative Lis1 binding surface lies principally on the edge of the ring at AAA4, toward the linker face, and encompasses amino acids within AAA4 whose mutation impairs Lis1 binding (see Figures S5A–S5C). In X-ray structure PDB 4AKI, the truncated N-terminal end of the linker lies close to the putative Lis1 binding surface but does not directly overlap. In constructs with the full-length linker (as seen in Dictyostelium dynein structure PDB 3VKG; Kon et al., 2012), direct linker-Lis1 contact may be possible.
Figure S5
Figure S5
Sequence Analysis and Characterization of Dynein Mutants, Related to Figure 6 (A) Alignment of dynein heavy chain sequences, showing the amino acid conservation at the AAA3/4 junction. The source organism and dynein isoform are indicated for each sequence (cyto, cytoplasmic dynein; IFT, intraflagellar transport dynein; outer/inner-arm, axonemal dynein). Sequences are colored according to BLOSUM62 score. Cylinders show the location of α helices, after PDB 4AKI (Schmidt et al., 2012). The four amino acids implicated in the Lis1 interaction by mutagenesis (red asterisks) are highly conserved among cytoplasmic dynein sequences. A notable exception is S. pombe, which also appears to lack a Lis1 ortholog. (B) Four mutations (K2721A, D2725G, E2726S, and E2727G) at the AAA3/4 junction in dynein (GST-dyneinKDEE) virtually abolish Lis1 binding under conditions in which the intact proteins coelute in a complex by size-exclusion chromatography. Traces show the elution profiles of Lis1 and GST-dynein331 kDa (blue) and Lis1 and GST-dyneinKDEE (red) in no nucleotide conditions. Elution volumes of standards with known Stokes radii (RS) and the void volume (V0) are shown above. (C) SDS-PAGE of size-exclusion chromatography fractions, colored as in (B). GST-dynein331 kDa and Lis1 coelute in a complex (blue bands), whereas GST-dyneinKDEE and Lis1 elute in separate fractions (red bands). (D) In contrast to the case of A. nidulans, introduction of the AAA4 arginine finger mutation (R2911C) into S. cerevisiae dynein does not rescue the nuclear segregation defect caused by the absence of Lis1 (Lis1Δ). This likely is because Lis1 is essential for proper dynein localization at the microtubule plus end in S. cerevisiae (Lee et al., 2003; Sheeman et al., 2003), whereas in A. nidulans, this can occur independently of Lis1 (Zhang et al., 2003). The mean and SE of proportion are shown (n > 202 per data point).

Comment in

References

    1. Allan V.J. Cytoplasmic dynein. Biochem. Soc. Trans. 2011;39:1169–1178. - PubMed
    1. Burgess S.A., Walker M.L., Sakakibara H., Knight P.J., Oiwa K. Dynein structure and power stroke. Nature. 2003;421:715–718. - PubMed
    1. Cho C., Vale R.D. The mechanism of dynein motility: insight from crystal structures of the motor domain. Biochim. Biophys. Acta. 2012;1823:182–191. - PMC - PubMed
    1. Cho C., Reck-Peterson S.L., Vale R.D. Regulatory ATPase sites of cytoplasmic dynein affect processivity and force generation. J. Biol. Chem. 2008;283:25839–25845. - PMC - PubMed
    1. Delanoue R., Davis I. Dynein anchors its mRNA cargo after apical transport in the Drosophila blastoderm embryo. Cell. 2005;122:97–106. - PubMed

Supplemental References

    1. Case, R.B., Pierce, D.W., Hom-Booher, N., Hart, C.L., and Vale, R.D. (1997). The directional preference of kinesin motors is specified by an element outside of the motor catalytic domain. Cell 90, 959–966. - PubMed
    1. Cho, C., Reck-Peterson, S.L., and Vale, R.D. (2008). Regulatory ATPase sites of cytoplasmic dynein affect processivity and force generation. J. Biol. Chem. 283, 25839–25845. - PMC - PubMed
    1. Eshel, D., Urrestarazu, L.A., Vissers, S., Jauniaux, J.C., van Vliet-Reedijk, J.C., Planta, R.J., and Gibbons, I.R. (1993). Cytoplasmic dynein is required for normal nuclear segregation in yeast. Proc. Natl. Acad. Sci. USA 90, 11172–11176. - PMC - PubMed
    1. Frank, J., Radermacher, M., Penczek, P., Zhu, J., Li, Y., Ladjadj, M., and Leith, A. (1996). SPIDER and WEB: processing and visualization of images in 3D electron microscopy and related fields. J. Struct. Biol. 116, 190–199. - PubMed
    1. Guthrie, C., and Fink, G.R., eds. (1991). Guide to yeast genetics and molecular biology (San Diego: Academic Press).

Publication types

MeSH terms

Substances