. 2012 Aug 31;150(5):1055-67.
doi: 10.1016/j.cell.2012.06.052.

Role of leaky neuronal ryanodine receptors in stress-induced cognitive dysfunction

Affiliations

Role of leaky neuronal ryanodine receptors in stress-induced cognitive dysfunction

Xiaoping Liu et al. Cell. .

Abstract

The type 2 ryanodine receptor/calcium release channel (RyR2), required for excitation-contraction coupling in the heart, is abundant in the brain. Chronic stress induces catecholamine biosynthesis and release, stimulating β-adrenergic receptors and activating cAMP signaling pathways in neurons. In a murine chronic restraint stress model, neuronal RyR2 were phosphorylated by protein kinase A (PKA), oxidized, and nitrosylated, resulting in depletion of the stabilizing subunit calstabin2 (FKBP12.6) from the channel complex and intracellular calcium leak. Stress-induced cognitive dysfunction, including deficits in learning and memory, and reduced long-term potentiation (LTP) at the hippocampal CA3-CA1 connection were rescued by oral administration of S107, a compound developed in our laboratory that stabilizes RyR2-calstabin2 interaction, or by genetic ablation of the RyR2 PKA phosphorylation site at serine 2808. Thus, neuronal RyR2 remodeling contributes to stress-induced cognitive dysfunction. Leaky RyR2 could be a therapeutic target for treatment of stress-induced cognitive dysfunction.


Figures

Figure 1
Figure 1. Chronic Stress Response in WT and in the RyR2-S2808A+/+Mice
(A) Mice were randomly divided into groups as indicated. Stressed mice were subjected to chronic restraint stress in Plexiglas restraint tubes overnight daily for 3 weeks, S107 (75mg/Kg/day) in drinking water was begun 3 days before stress and throughout the experiment. (B) Plasma corticosterone levels were assayed in the morning. Data are mean ± S.E.M., n=4. (C) Representative immunoblots showing pCREB and pERK in control and stressed mice. Hippocampal samples were isolated immediately after 3-weeks of stress from WT and RyR2- S2808A+/+ mice. (D, E) Summary data (mean ± S.E.M., n=5) are shown for pCREB (C) and pERK (D). Total CREB, total ERK and GAPDH are loading controls. See also Figures S1.
Figure 2
Figure 2. Stress-induced Remodeling of Neuronal RyR2 Macromolecular Complexes
(A) Hippocampal RyR2 was immunoprecipitated and immunoblotted to detect PKA hyperphosphorylation, oxidation and Cys S-nitrosylation of RyR2 and calstabin2 as previously described (Marx et al., 2000; Reiken et al., 2003b; Shan et al., 2010a; Shan et al., 2010b; Ward et al., 2003) (B-E) Summary data for RyR2-pS2808, Cys S-nitrosylation, DNP (oxidation), and calstabin2. Data are mean ± S.E.M., *, **, #p<0.05, n=5. The mean for the unstressed control was set = 1.0. (F) ER microsomes were resuspended and treated with PKA (40units), H2O2 (1mM), Noc-12 (100μM) separately, or in combination. Treated microsomes were immunoprecipitated and immunoblotted with the antibodies described in A-E. (G) Summary data for F, immunoblot data for calstabin2/RyR2. (H) Kds for 35S-calstabin2 binding to RyR2. Data are mean ± S.E.M., *, **, #p<0.05, ##p<0.01, n=5. See also Figures S3-S5.
Figure 3
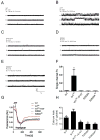
Figure 3. Single Channel Recordings of Hippocampal RyR Channels from Stressed Mice
(A-C) Representative hippocampal RyR single-channel current traces from control (WT, n=6) (A), stress (WTStr, n=5) (B), S107 treated stress (WTStr+S107, n=5) (C), RyR2-S2808A+/+ (S2808A, n=4) (D), and stressed RyR2-S2808A+/+ mice (S2808AStr, n=6) (E) examined with 150 nmol/L (nM) free cytosolic [Ca2+] in the cis chamber. Channel openings are upward deflections and horizontal bars at the left of each trace indicate the closed (c-) state of the channels. For each group, channel activity is illustrated with 4 traces, each 5 s. RyR identity was confirmed by addition of 5 μmol/L (μM) ryanodine at the end of each experiment. The single channel open probability (Po), To (mean open time) and Tc (mean closed time) at 150 nmol/L free cytosolic [Ca2+] are above the upper trace. (F) Summary of RyR2 single-channel Po with 150 nmol/L free cytosolic [Ca2+] from RyR2-WT, RyR2-WTStr, WTStr+S107, S2808A and S2808AStr. Data are mean ± S.E.M., *p < 0.05 vs. WT. (G) Representative traces of Ca2+ leak from brain microsomes induced by addition of thapsigargin (3 μM). (H) Ca2+ leak was calculated as the percentage of uptake. Data (mean ± S.E.M.) analysis was performed by one-way ANOVA, p=0.0001. Bonferroni post-test revealed *p<0.05 vs. WTStr (WT, n=9; WTStr, n=7; WTStr+S107, n=7; S2808A, n=4; S2808A+ST, n=4). See also Figure S3H-K.
Figure 4
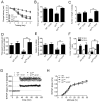
Figure 4. Effects of Stress on Cognitive Function and Hippocampal Synaptic Plasticity
(A) MWM escape latency for WT non-stressed control (WT, n=21), S107 treated WT non-stressed (WT+S107, n=14), WT stressed (WTStr, n=21), and S107 treated stressed (WTStr+S107, n=22). (B, C) Probe trials measuring time spent in the target quadrant and number of target crossings. <0.05. (D, E) EPM test on the same groups of mice. (D) Summary of ratios of time-spent on the open-arm versus closed-arm are shown. (E) Summary data of ratios of number of entries to the open-arm versus closed-arm are shown. (F) Open-field test from the same group of mice as shown in MWM and EPM tests. *p<0.05 versus non-stressed controls within the first 3 min, #p<0.05 versus non-stressed controls within the second 3 min. (G) Potentiation following theta-burst stimulation in the CA1 region of hippocampal slices from WT mice (WT, n=7), S107 treated control (WT+S107, n=7), stress (WTStr, n=7), and S107 treated stress (WTStr+S107, n=7). (H) Summary of field input-output relationships in the same slices as in (G). All data are mean ± S.E.M. See also Figure S3G.
Figure 5
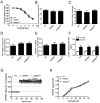
Figure 5. Effects of Stress on Cognitive Function and Hippocampal Synaptic Plasticity in RyR2-S2808A+/+Mice
(A) MWM escape latency for WT (WT, n=15), RyR2-S2808A+/+ non-stressed (S2808A, n=13), and RyR2-S2808A+/+ stressed (S2808AStr, n=16). (B, C) Probe trials after escape platform removed, *p<0.05. (D, E) EPM test in the same groups. (D) Summary data of ratios of time-spent on the open-arm versus closed-arm. (E) Summary data of ratios of number of entries to the open-arm versus closed-arm. (F) Open-field test from the same group of mice. Ratios of total time spent in the center area versus periphery area within first 3 min and 2nd 3 min. (G) Potentiation following theta-burst stimulation in the CA1 region of hippocampal slices from WT mice (WT, n=7), RyR2-S2808A+/+ (S2808A, n=7) and stressed RyR2-S2808A+/+ (S2808AStr, n=7). (H) Field input-output relationships in the same slices as in (G). See also Figures S3G-S7. All data are mean ± S.E.M.
Figure 6
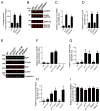
Figure 6. Stress-induced Remodeling of RyR1 Complexes and Cognitive Function in RyR1-S2844A+/+mice
(A) RyR2-S2844A+/+ mice were subjected to the restraint stress protocol in Figure 1A. Morning plasma corticosterone levels collected. n=4. (B) Representative immunoblots showing levels of hippocampal pCREB and pERK in control and stressed mice. Summary data for the levels of pCREB (C) and pERK (D). Total CREB, total ERK and GAPDH were loading controls. (E) Representative immunoblots of RyR1 immunoprecipitated from whole brain samples from control (WT), WT stressed (WTStr), RyR1-S2844A+/+ (S2844A), and RyR1-S2844A+/+ stressed (S2844AStr) probed with antibodies showing PKA hyperphosphorylation, oxidation (DNP), Cys S-nitrosylation (CysNO) of RyR1, and co-immunoprecipitated calstabin1. (F-I) Summary data for phosphorylated RyR1, oxidized and nitrosylated RyR1, and calstabin1. *, **, #p<0.05, n=4. The mean for the unstressed WT control was taken as 1.0. All data are mean ± S.E.M. See also Figure S5E-G.
Figure 7
Figure 7. Effects of Stress on Cognitive Function in RyR1-S2844A+/+Mice
(A) MWM escape latency in WT (WT, n=30), RyR1-S2844A+/+ (S2844A, n=30), and stressed RyR1-S2844A+/+ (S2844AStr, n=12). (B, C) Probe trial after removal of escape platform, *p<0.05. (D, E) EPM in the same groups of mice. (D) Summary data for ratios of time-spent on the open-arm versus closed-arm are shown. (E) Summary data for ratios of number of entries to the open-arm versus closed-arm are shown. (F) Results of open-field test from the same groups of mice. Ratios of total time spent in the center area versus periphery area within first 3 min and 2nd 3 min are shown. All data are mean ± S.E.M. See also Figure S3G.

Comment in

Similar articles

Cited by

References

    1. Aguilera G. Regulation of pituitary ACTH secretion during chronic stress. Front Neuroendocrinol. 1994;15:321–350. - PubMed
    1. Airan RD, Meltzer LA, Roy M, Gong Y, Chen H, Deisseroth K. High-speed imaging reveals neurophysiological links to behavior in an animal model of depression. Science. 2007;317:819–823. - PubMed
    1. Andersson DC, Betzenhauser MJ, Reiken S, Meli AC, Umanskaya A, Xie W, Shiomi T, Zalk R, Lacampagne A, Marks AR. Ryanodine receptor oxidation causes intracellular calcium leak and muscle weakness in aging. Cell Metab. 2011;14:196–207. - PMC - PubMed
    1. Bellinger AM, Mongillo M, Marks AR. Stressed out: the skeletal muscle ryanodine receptor as a target of stress. J Clin Invest. 2008a;118:445–453. - PMC - PubMed
    1. Bellinger AM, Reiken S, Carlson C, Mongillo M, Liu X, Rothman L, Matecki S, Lacampagne A, Marks AR. Hypernitrosylated ryanodine receptor calcium release channels are leaky in dystrophic muscle. Nat Med. 2009;15:325–330. - PMC - PubMed

Publication types

Substances