. 2012 Oct 15;211(1):145-58.
doi: 10.1016/j.jneumeth.2012.08.013. Epub 2012 Aug 23.

Detection of bursts and pauses in spike trains

Affiliations

Detection of bursts and pauses in spike trains

D Ko et al. J Neurosci Methods. .

Abstract

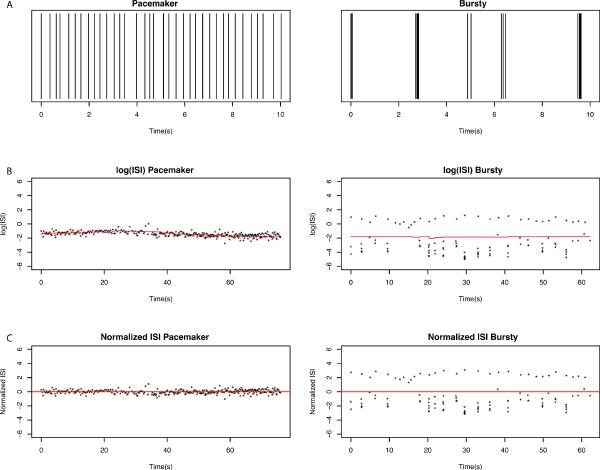
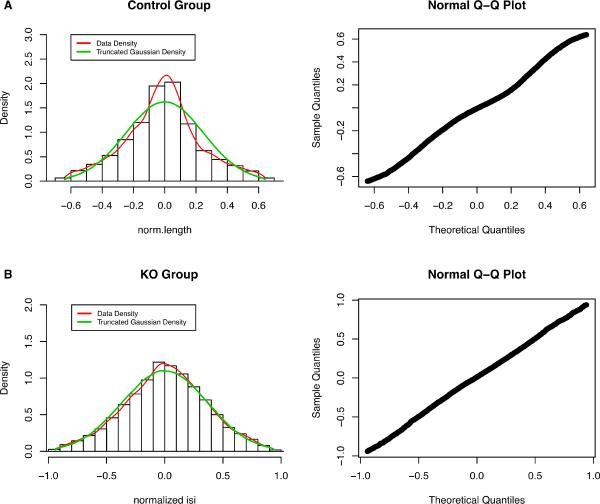
Midbrain dopaminergic neurons in vivo exhibit a wide range of firing patterns. They normally fire constantly at a low rate, and speed up, firing a phasic burst when reward exceeds prediction, or pause when an expected reward does not occur. Therefore, the detection of bursts and pauses from spike train data is a critical problem when studying the role of phasic dopamine (DA) in reward related learning, and other DA dependent behaviors. However, few statistical methods have been developed that can identify bursts and pauses simultaneously. We propose a new statistical method, the Robust Gaussian Surprise (RGS) method, which performs an exhaustive search of bursts and pauses in spike trains simultaneously. We found that the RGS method is adaptable to various patterns of spike trains recorded in vivo, and is not influenced by baseline firing rate, making it applicable to all in vivo spike trains where baseline firing rates vary over time. We compare the performance of the RGS method to other methods of detecting bursts, such as the Poisson Surprise (PS), Rank Surprise (RS), and Template methods. Analysis of data using the RGS method reveals potential mechanisms underlying how bursts and pauses are controlled in DA neurons.


Figures

Figure 1
Figure 1
Examples of the log (ISIi) along with E-center (black line), step 2 Update (green), and step 3 Central location (red) curves with the corresponding log (ISI). A. The pacemaker spike train, which did not have bursts or pauses. B. Spike train with bursts, pauses, and baseline firing. C. Baseline firing with bursts, and no pauses. D. Baseline firing with pauses, and no bursts.
Figure 2
Figure 2
A. Spike trains of the first 10 seconds from two in vivo extracellular recordings from anesthetized mice: one recording displaying a pacemaker pattern (left) and another displaying a burst pattern with pauses (right). Each vertical line represents one spike of activity from the recorded neuron. B. The ISI's are transformed into log (ISI), and the moving central location (red line) is determined. C. The log (ISI) is normalized so that E-center is centered at 0.
Figure 3
Figure 3
Distribution of Pooled NLISIs. The pooled center part ISI's for each group (Control on left; KO on right) display the central distribution from which bursts and pauses in individual spike trains can be determined.
Figure 4
Figure 4
A. Histogram of Central NLISIs (left) and Normal Q-Q plot (right) for the Control Group. The data density (red line) is the nonparametric density estimate of truncated NLISIs, and the Truncated Gaussian Density (green line) is the corresponding theoretical density of the truncated Gaussian distribution. B. The histogram of Central NLISIs (left) and Normal Q-Q plot (right) for the KO group indicate that the NLISIs in the KO group are very close to the theoretical truncated Gaussian distribution.
Figure 5
Figure 5
Kernel Density Estimates of bivariate NLISIs among Control Group (left) and KO Group (right). Observed correlations are small in both groups (0.12 Control; −0.08 KO), indicating that the central parts of the normalized ISI's for both groups have independent Gaussian distributions centered about zero.
Figure 6
Figure 6
Summary of True Positive, and False Positive rates for bursts and pauses for the RGS method along with Poisson Surprise, Rank Surprise, and Template methods. A. Burst Detection for Simulated Spike Trains. B. Pause Detection for Simulated Spike Trains
Figure 7
Figure 7
Sample spike train analyzed using the Template (a), Poisson Surprise (b), and Robust Gaussian Surprise (c) methods. The top spike train displays the first 50 seconds while the bottom spike train shows the same spike train at higher temporal resolution (first 10 seconds). The horizontal lines above the spike trains represent pause significance, and the horizontal lines below the spike trains represent burst significance. A. The Template method detects bursts although no measure of significance is provided. This method also does not detect pauses. B. The Poisson Surprise method detects bursts and pauses although some pauses are not detected (see missed pauses between 8 and 10 seconds in bottom train). This method also relies on the background firing rate remaining stable. C. The Robust Gaussian Surprise method provides level of significance, and reliably detects all bursts and pauses even with a varying background firing rate.
Figure 8
Figure 8
Sample spike train analyzed using the Template (a), and Robust Gaussian Surprise (b) methods. The top spike train displays the first 50 seconds while the bottom spike train shows the same spike train at higher temporal resolution (last 10 seconds). The horizontal lines above the spike trains represent pause significance, and the horizontal lines below the spike trains represent burst significance. A. The Template method detects more bursts although no measure of significance is provided. B. The Robust Gaussian Surprise method provides level of significance, and reliably detects all bursts and pauses even though the background firing rate is high.
Figure 9
Figure 9
Mean number of burst (left) and pauses (right) in the Control and KO groups. Both bursts and pauses are significantly reduced in the KO group.
Figure 10
Figure 10
Bursts and pauses were identified using the RGS method in spike trains from both the Control and KO groups. The number of pauses is correlated with the number of bursts in both the KO and Control groups.

References

    1. Cateau H, Reyes AD. Relation between single neuron and population spiking statistics and effects on network activity. Phys Rev Lett. 2006;96:058101. - PubMed
    1. Chergui K, Suaud-Chagny MF, Gonon F. Nonlinear relationship between impulse flow, dopamine release and dopamine elimination in the rat brain in vivo. Neuroscience. 1994;62:641–645. - PubMed
    1. Chergui K, Charlety PJ, Akaoka H, Saunier CF, Brunet JL, Buda M, Svensson TH, Chouvet G. Tonic activation of NMDA receptors causes spontaneous burst discharge of rat midbrain dopamine neurons in vivo. Eur J Neurosci. 1993;5:137–144. - PubMed
    1. Christoffersen CL, Meltzer LT. Evidence for N-methyl-D-aspartate and AMPA subtypes of the glutamate receptor on substantia nigra dopamine neurons: possible preferential role for N-methyl-D-aspartate receptors. Neuroscience. 1995;67:373–381. - PubMed
    1. De Schutter E, Steuber V. Patterns and pauses in Purkinje cell simple spike trains: experiments, modeling and theory. Neuroscience. 2009;162:816–826. - PubMed

Publication types

LinkOut - more resources