

Leukemic blasts with the paroxysmal nocturnal hemoglobinuria phenotype in children with acute lymphoblastic leukemia
- PMID: 22940070
- PMCID: PMC3483812
- DOI: 10.1016/j.ajpath.2012.07.025
Leukemic blasts with the paroxysmal nocturnal hemoglobinuria phenotype in children with acute lymphoblastic leukemia
Abstract
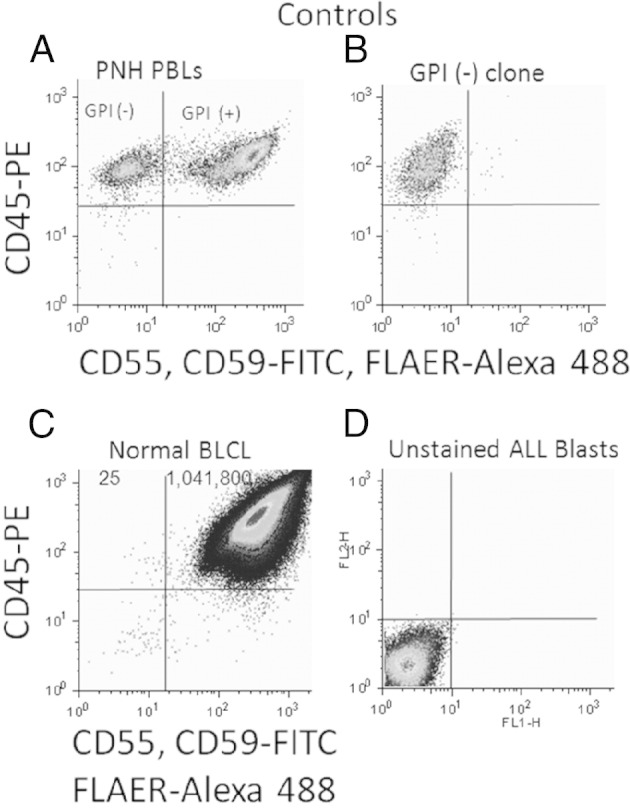
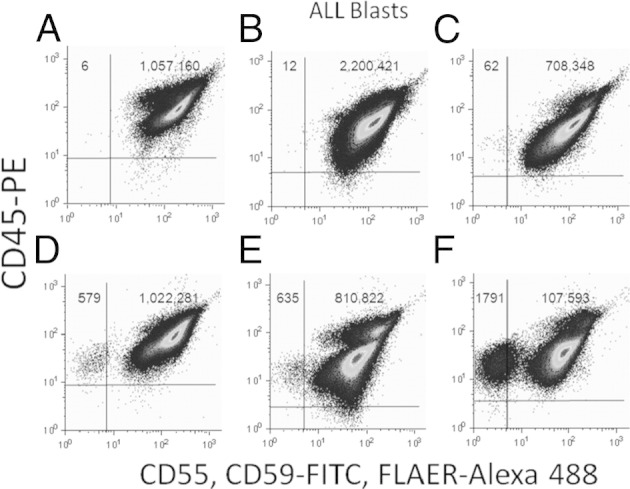
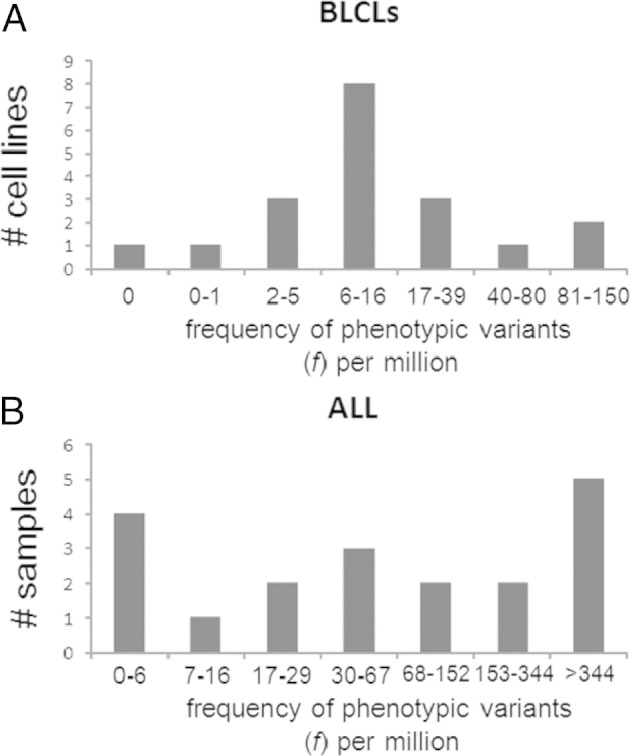
It has been proposed that genomic instability is essential to account for the multiplicity of mutations often seen in malignancies. Using the X-linked PIG-A gene as a sentinel gene for spontaneous inactivating somatic mutations, we previously showed that healthy individuals harbor granulocytes with the PIG-A mutant (paroxysmal nocturnal hemoglobinuria) phenotype at a median frequency (f) of ∼12 × 10(-6). Herein, we used a similar approach to determine f in blast cells derived from 19 individuals with acute lymphoblastic leukemia (ALL) and in immortalized Epstein-Barr virus-transformed B-cell cultures (human B-lymphoblastoid cell lines) from 19 healthy donors. The B-lymphoblastoid cell lines exhibited a unimodal distribution, with a median f value of 11 × 10(-6). In contrast, analysis of the f values for the ALL samples revealed at least two distinct populations: one population, representing approximately half of the samples (n = 10), had a median f value of 13 × 10(-6), and the remaining samples (n = 9) had a median f value of 566 × 10(-6). We conclude that in ALL, there are two distinct phenotypes with respect to hypermutability, which we hypothesize will correlate with the number of pathogenic mutations required to produce the leukemia.
Copyright © 2012 American Society for Investigative Pathology. Published by Elsevier Inc. All rights reserved.
Figures
Similar articles
-
Coexistence of paroxysmal nocturnal hemoglobinuria (PNH) and acute lymphoblastic leukemia (ALL): Is PNH a prodrome of ALL?Leuk Res. 2009 Mar;33(3):e3-5. doi: 10.1016/j.leukres.2008.05.016. Epub 2008 Jul 1. Leuk Res. 2009. PMID: 18597843 No abstract available.
-
Transformation of aplastic anemia with paroxysmal nocturnal hemoglobinuria clone to childhood B-cell precursor acute lymphoblastic leukemia.Pediatr Blood Cancer. 2024 Jul;71(7):e30994. doi: 10.1002/pbc.30994. Epub 2024 Apr 11. Pediatr Blood Cancer. 2024. PMID: 38605541 No abstract available.
-
Allogeneic stem-cell transplantation in patients with refractory acute leukemia: a long-term follow-up.Bone Marrow Transplant. 2006 Jan;37(1):45-50. doi: 10.1038/sj.bmt.1705207. Bone Marrow Transplant. 2006. PMID: 16258531
-
Paroxysmal nocturnal hemoglobinuria and the risk of venous thrombosis: review and recommendations for management of the pregnant and nonpregnant patient.Haemostasis. 2000 May-Jun;30(3):103-17. doi: 10.1159/000022532. Haemostasis. 2000. PMID: 11014960 Review.
-
Relationship between aplastic anemia and paroxysmal nocturnal hemoglobinuria.Int J Hematol. 2002 Feb;75(2):117-22. doi: 10.1007/BF02982015. Int J Hematol. 2002. PMID: 11939256 Review.
Cited by
-
The rate of spontaneous mutations in human myeloid cells.Mutat Res. 2013 Sep;749(1-2):49-57. doi: 10.1016/j.mrfmmm.2013.05.004. Epub 2013 Jun 6. Mutat Res. 2013. PMID: 23748046 Free PMC article.
-
MSH6 haploinsufficiency at relapse contributes to the development of thiopurine resistance in pediatric B-lymphoblastic leukemia.Haematologica. 2018 May;103(5):830-839. doi: 10.3324/haematol.2017.176362. Epub 2018 Feb 15. Haematologica. 2018. PMID: 29449434 Free PMC article.
-
Loss of the GPI-anchor in B-lymphoblastic leukemia by epigenetic downregulation of PIGH expression.Am J Hematol. 2019 Jan;94(1):93-102. doi: 10.1002/ajh.25337. Epub 2018 Nov 25. Am J Hematol. 2019. PMID: 30370942 Free PMC article.
References
-
- Morley A., Cox S., Holliday R. Human lymphocytes resistant to 6-thioguanine increase with age. Mech Ageing Dev. 1982;19:21–26. - PubMed
-
- Langlois R., Bigbee W., Jensen R. Flow cytometric characterization of normal and variant cells with monoclonal antibodies specific for glycophorin A. J Immunol. 1985;134:4009–4017. - PubMed
-
- Langlois R., Bigbee W., Jensen R. Measurements of the frequency of human erythrocytes with gene expression loss phenotypes at the glycophorin A locus. Hum Genet. 1986;74:353–362. - PubMed
-
- Vickers M.A., Hoy T., Lake H., Kyoizumi S., Boyse J., Hewitt M. Estimation of mutation rate at human glycophorin A locus in hematopoietic stem cell progenitors. Environ Mol Mutagen. 2002;39:333–341. - PubMed
Publication types
MeSH terms
Grants and funding
LinkOut - more resources
Full Text Sources
Research Materials
