

PTEN loss in the Myf5 lineage redistributes body fat and reveals subsets of white adipocytes that arise from Myf5 precursors
- PMID: 22940198
- PMCID: PMC3488151
- DOI: 10.1016/j.cmet.2012.08.003
PTEN loss in the Myf5 lineage redistributes body fat and reveals subsets of white adipocytes that arise from Myf5 precursors
Abstract
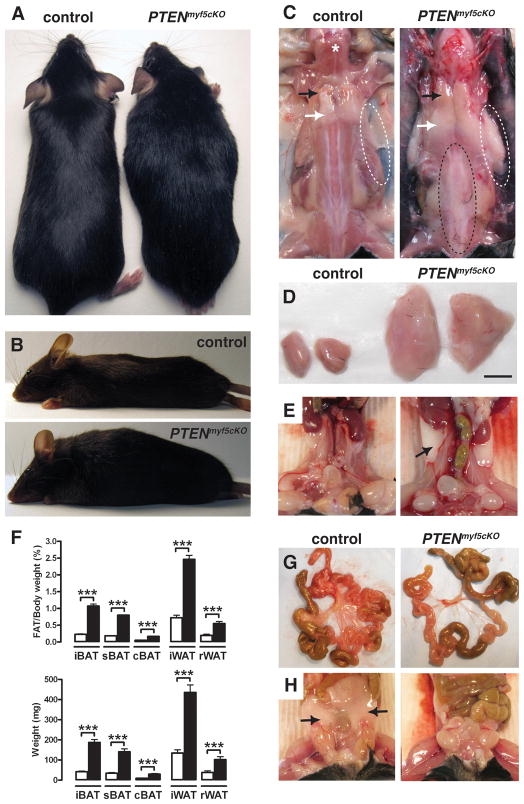
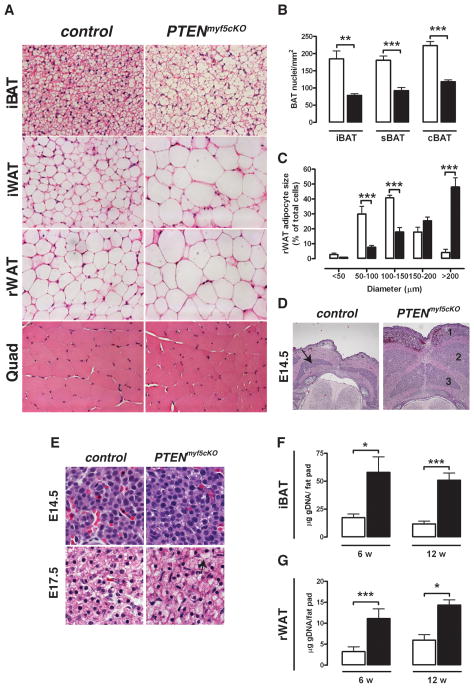
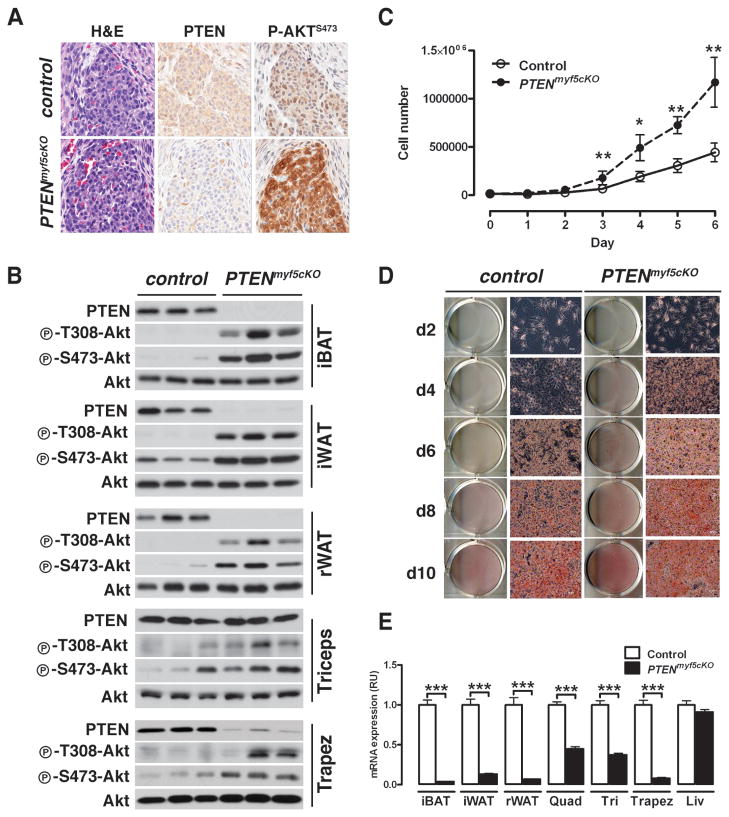
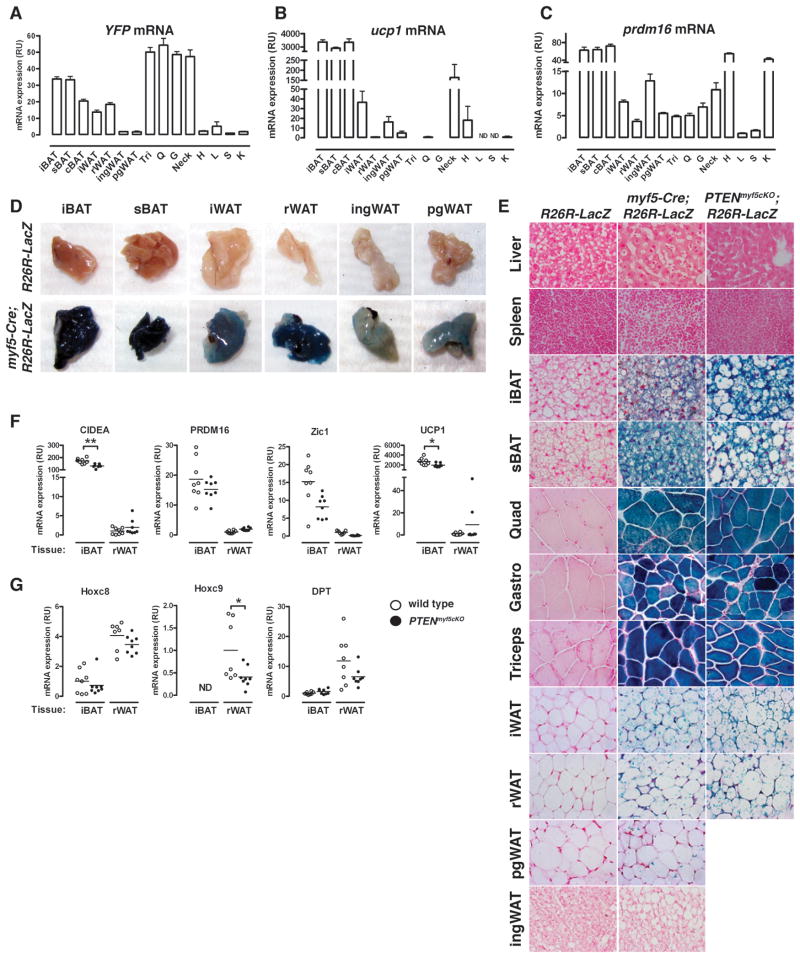
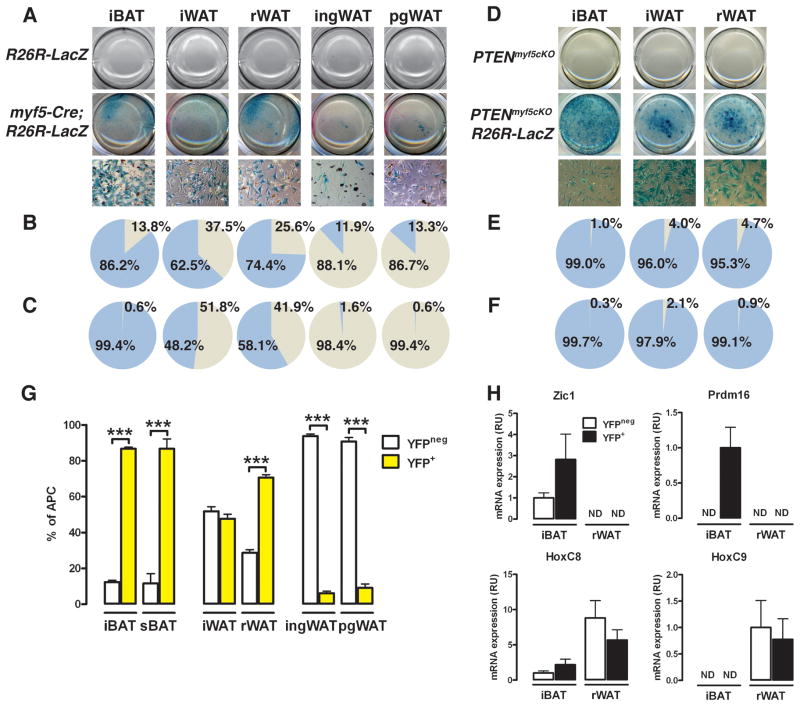
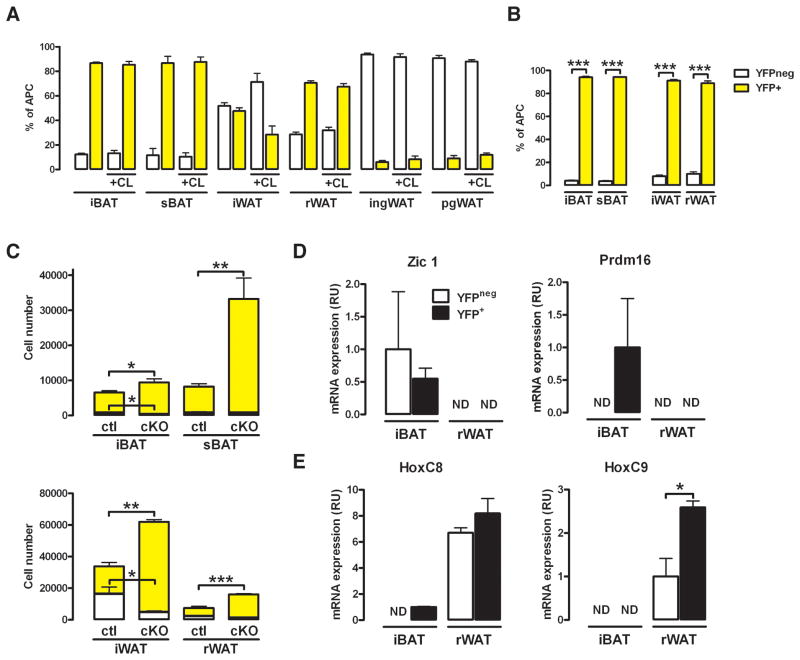
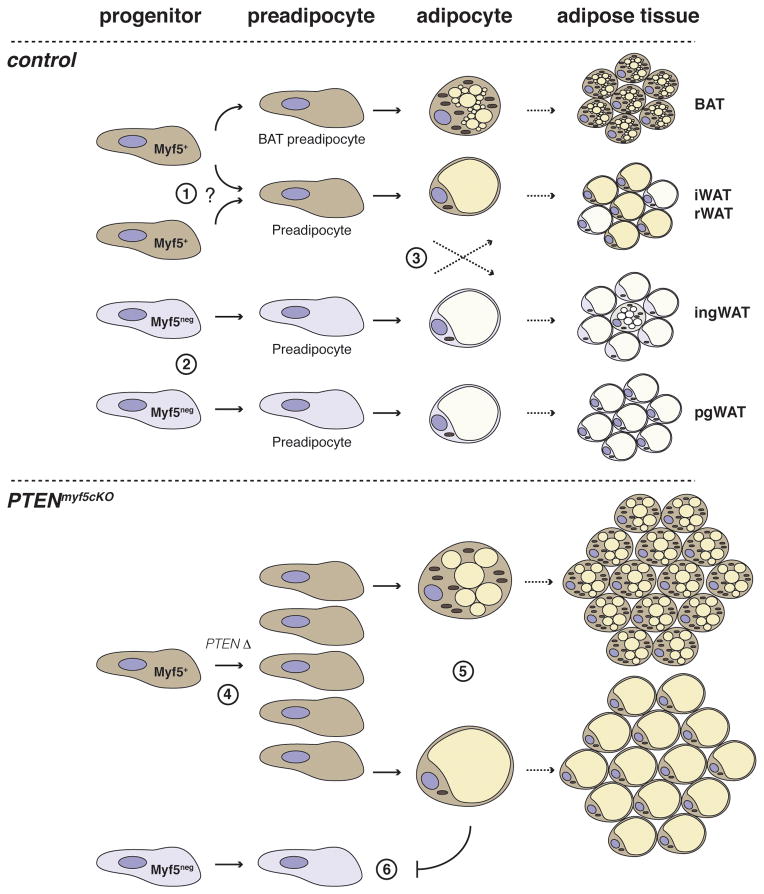
The developmental origin of adipose tissue and what controls its distribution is poorly understood. By lineage tracing and gene expression analysis in mice, we provide evidence that mesenchymal precursors expressing Myf5--which are thought to give rise only to brown adipocytes and skeletal muscle--also give rise to a subset of white adipocytes. Furthermore, individual brown and white fats contain a mixture of adipocyte progenitor cells derived from Myf5(+) and Myf5(neg) lineages, the number of which varies with depot location. Subsets of white adipocytes originating from both Myf5(+) and Myf5(neg) precursors respond to β(3)-adrenoreceptor stimulation, suggesting "brite" adipocytes may also have multiple origins. We additionally find that deleting PTEN with myf5-cre causes lipomatosis and partial lipodystrophy by selectively expanding the Myf5(+) adipocyte lineages. Thus, the spectrum of adipocytes arising from Myf5(+) precursors is broader than previously thought, and differences in PI3K activity between adipocyte lineages alter body fat distribution.
Conflict of interest statement
The authors declare no conflict of interests.
Figures
Similar articles
-
Adipocyte lineages: tracing back the origins of fat.Biochim Biophys Acta. 2014 Mar;1842(3):340-51. doi: 10.1016/j.bbadis.2013.05.027. Epub 2013 Jun 4. Biochim Biophys Acta. 2014. PMID: 23747579 Free PMC article. Review.
-
Adipocytes arise from multiple lineages that are heterogeneously and dynamically distributed.Nat Commun. 2014 Jun 19;5:4099. doi: 10.1038/ncomms5099. Nat Commun. 2014. PMID: 24942009 Free PMC article.
-
Distinct populations of adipogenic and myogenic Myf5-lineage progenitors in white adipose tissues.J Lipid Res. 2013 Aug;54(8):2214-2224. doi: 10.1194/jlr.M038711. Epub 2013 Jun 5. J Lipid Res. 2013. PMID: 23740968 Free PMC article.
-
Disruption of insulin signaling in Myf5-expressing progenitors leads to marked paucity of brown fat but normal muscle development.Endocrinology. 2015 May;156(5):1637-47. doi: 10.1210/en.2014-1773. Epub 2015 Jan 27. Endocrinology. 2015. PMID: 25625589 Free PMC article.
-
The emergence of adipocytes.Endocr Dev. 2010;19:21-30. doi: 10.1159/000316894. Epub 2010 Jun 15. Endocr Dev. 2010. PMID: 20551665 Review.
Cited by
-
Adipocyte lineages: tracing back the origins of fat.Biochim Biophys Acta. 2014 Mar;1842(3):340-51. doi: 10.1016/j.bbadis.2013.05.027. Epub 2013 Jun 4. Biochim Biophys Acta. 2014. PMID: 23747579 Free PMC article. Review.
-
The Function and Mechanism of Long Noncoding RNAs in Adipogenic Differentiation.Genes (Basel). 2024 Jul 3;15(7):875. doi: 10.3390/genes15070875. Genes (Basel). 2024. PMID: 39062654 Free PMC article. Review.
-
Pharmacological inhibition of the lipid phosphatase PTEN ameliorates heart damage and adipose tissue inflammation in stressed rats with metabolic syndrome.Physiol Rep. 2022 Jan;10(1):e15165. doi: 10.14814/phy2.15165. Physiol Rep. 2022. PMID: 35005845 Free PMC article.
-
Weighing in on adipocyte precursors.Cell Metab. 2014 Jan 7;19(1):8-20. doi: 10.1016/j.cmet.2013.10.003. Epub 2013 Nov 14. Cell Metab. 2014. PMID: 24239569 Free PMC article. Review.
-
Erchen Decoction Ameliorates the Metabolic Abnormalities of High-Fat Diet-Fed Rats.Comput Math Methods Med. 2022 Jul 6;2022:2183542. doi: 10.1155/2022/2183542. eCollection 2022. Comput Math Methods Med. 2022. Retraction in: Comput Math Methods Med. 2023 Oct 4;2023:9853297. doi: 10.1155/2023/9853297. PMID: 35844447 Free PMC article. Retracted.
References
-
- Atit R, Sgaier SK, Mohamed OA, Taketo MM, Dufort D, Joyner AL, Niswander L, Conlon RA. Beta-catenin activation is necessary and sufficient to specify the dorsal dermal fate in the mouse. Dev Biol. 2006;296:164–176. - PubMed
-
- Billon N, Dani C. Developmental Origins of the Adipocyte Lineage: New Insights from Genetics and Genomics Studies. Stem Cell Rev 2011 - PubMed
-
- Bluher M, Michael MD, Peroni OD, Ueki K, Carter N, Kahn BB, Kahn CR. Adipose tissue selective insulin receptor knockout protects against obesity and obesity-related glucose intolerance. Dev Cell. 2002;3:25–38. - PubMed
-
- Cannon B, Nedergaard J. Brown adipose tissue: function and physiological significance. Physiol Rev. 2004;84:277–359. - PubMed
-
- Cinti S, Enzi G, Cigolini M, Bosello O. Ultrastructural features of cultured mature adipocyte precursors from adipose tissue in multiple symmetric lipomatosis. Ultrastruct Pathol. 1983;5:145–152. - PubMed
Publication types
MeSH terms
Substances
Grants and funding
LinkOut - more resources
Full Text Sources
Other Literature Sources
Molecular Biology Databases
Research Materials
