. 2012 Oct 23;22(20):1871-80.
doi: 10.1016/j.cub.2012.07.070. Epub 2012 Aug 30.

Electrical activity can impose time of day on the circadian transcriptome of pacemaker neurons

Affiliations

Electrical activity can impose time of day on the circadian transcriptome of pacemaker neurons

Dogukan Mizrak et al. Curr Biol. .

Abstract

Background: Circadian (∼24 hr) rhythms offer one of the best examples of how gene expression is tied to behavior. Circadian pacemaker neurons contain molecular clocks that control 24 hr rhythms in gene expression that in turn regulate electrical activity rhythms to control behavior.

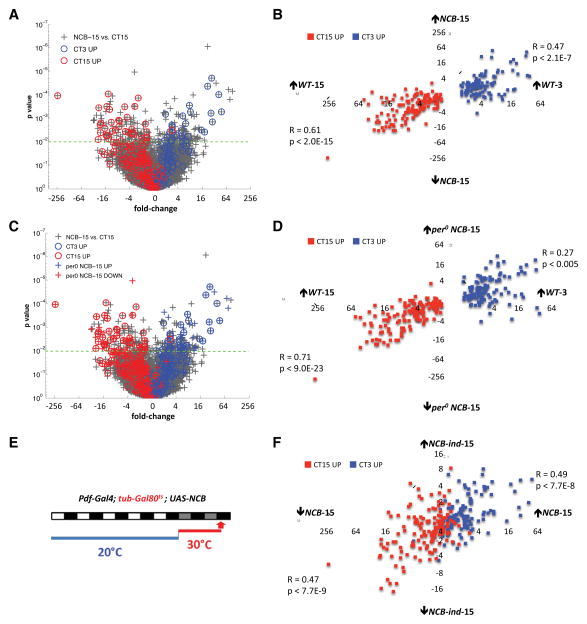
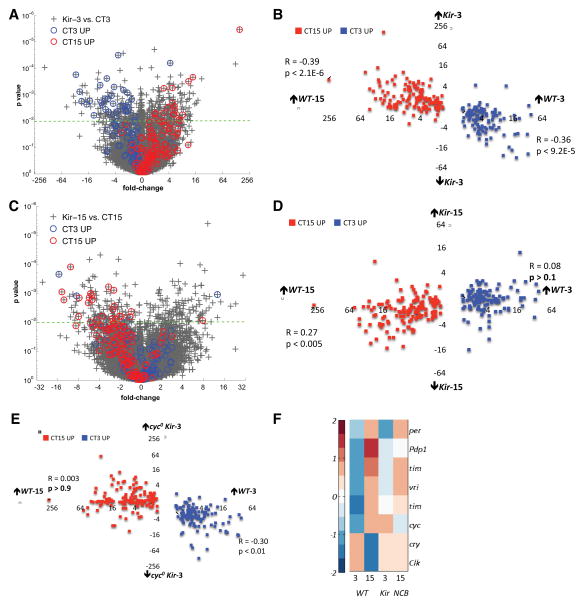
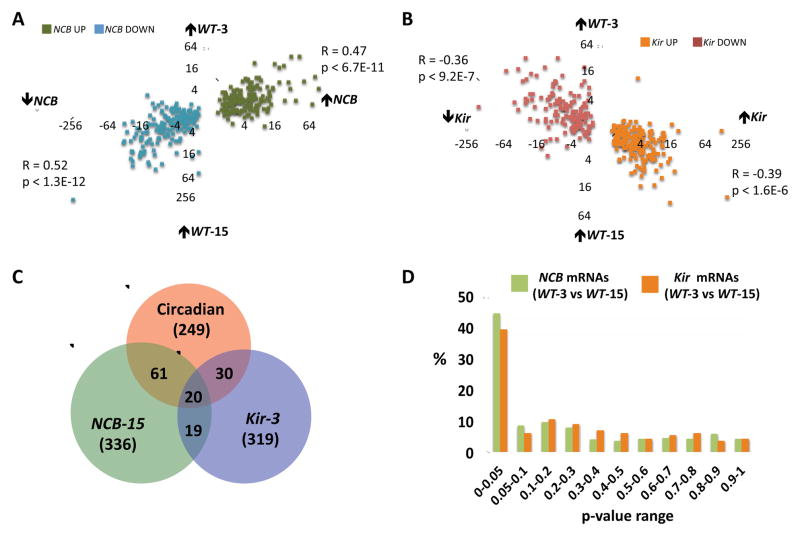
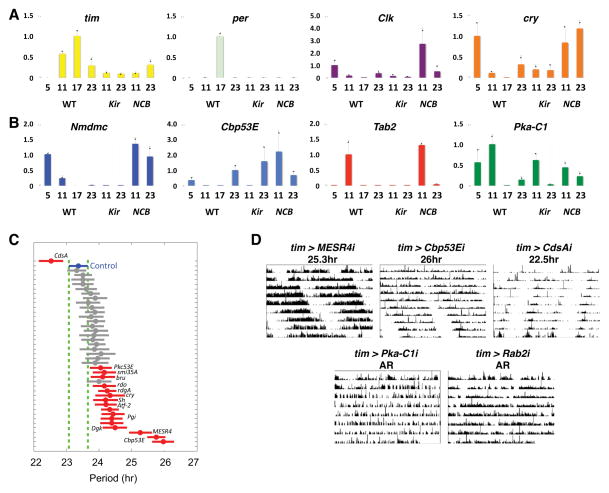
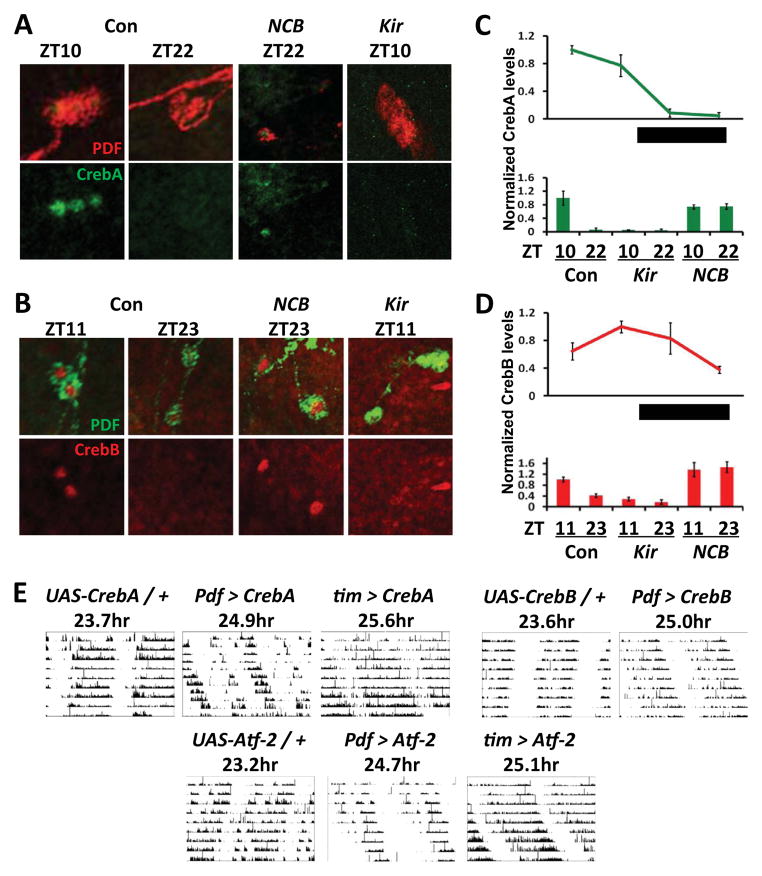
Results: Here we demonstrate the inverse relationship: there are broad transcriptional changes in Drosophila clock neurons (LN(v)s) in response to altered electrical activity, including a large set of circadian genes. Hyperexciting LN(v)s creates a morning-like expression profile for many circadian genes while hyperpolarization leads to an evening-like transcriptional state. The electrical effects robustly persist in per(0) mutant LN(v)s but not in cyc(0) mutant LN(v)s, suggesting that neuronal activity interacts with the transcriptional activators of the core circadian clock. Bioinformatic and immunocytochemical analyses suggest that CREB family transcription factors link LN(v) electrical state to circadian gene expression.

Conclusions: The electrical state of a clock neuron can impose time of day to its transcriptional program. We propose that this acts as an internal zeitgeber to add robustness and precision to circadian behavioral rhythms.


Figures

Figure 1
Figure 1. Hyperexciting LNvs creates a morning-like transcript profile in the evening
(A) Scatter-plot of fold change versus p-value for all mRNAs in the NCB-15 vs. WT-15 comparison (grey “+”). We identifed 336 NCB-regulated mRNAs using p<.01, FDR < 8 and FC > 1.5 as cut-offs. The 249 circadian genes are identified with blue (high at CT3) or red (high at CT15) circles. (B) Scatter-plot of wild type circadian fold differences (WT-3 vs. WT-15) for each of the 249 circadian mRNAs against their NCB-fold differences (NCB-15 vs. WT-15). Blue boxes: mRNAs normally high at WT-3. Red boxes: mRNAs normally high at WT-15. Pearson correlation coefficients (R values) were transformed to test hypotheses of no correlation (p values). (C) Re-plot of the NCB-15 versus WT-15 comparison from Figure 1A with the addition of 246 mRNAs either up- (blue “+”) or down-regulated (red “+”) in the per0; NCB-15 vs. WT-15 comparison. (D) Scatter-plot of circadian fold differences (WT-3 vs. WT-15) for all circadian mRNAs against their per0; NCB-fold differences (per0; NCB-15 vs. WT-15). (E) Pdf-Gal4>NCB/tub-gal80ts larvae were entrained in LD cycles at 20°C, when Gal80t.s represses Gal4 activity to prevent NCB-expression. Larvae were transferred to DD at 30°C to induce NCB-expression (NCB-ind-15) and dissected at CT15 on day 2 in DD. Control larvae without a NCB transgene went through the same temperature shifts (Pdf-Gal4>+/tub-gal80ts, WT-ind-15). (F) Scatter-plot of fold differences for each of the 249 circadian mRNAs between the NCB-15 vs. WT-15 and NCB-ind-15 vs. WT-ind-15 comparisons.
Figure 2
Figure 2. Hyperpolarizing LNvs at morning induces an evening-like circadian expression pattern
(A&C) Scatter-plot of fold change versus p-value for all mRNAs in the Kir-3 vs. WT-3 (A) and Kir-15 vs. WT-15 (C) comparisons. Circadian genes (249) are identified with blue (high at WT-3) and red (high at WT-15) circles. (B&D) Scatter-plot of wild type circadian fold differences (WT-3 vs. WT-15) for each of the 249 circadian mRNAs against their Kir-3 fold differences (Kir-3 vs. WT-3, B) and Kir-15-fold differences (Kir-15 vs. WT-15, D). (E) Scatter-plot of wild type circadian fold differences (WT-3 vs. WT-15) for all circadian mRNAs against their cyc0; Kir-3 fold differences (cyc0; Kir-3 vs. WT-3). (F) Expression values for core clock mRNAs (row) across four genomic conditions (columns) standardized by mean centering (row mean = 0, row standard deviation =1) and assigned color-map values based on their standard deviation from the row mean.
Figure 3
Figure 3. A strong relationship between electrical activity and circadian gene expression in LNvs
(A) Scatter-plot of NCB fold differences (NCB-15 vs. WT-15) for all 336 NCB-regulated mRNAs against their circadian fold differences (WT-3 vs. WT-15). mRNAs up- and down-regulated by NCB are in green and blue respectively. (B) Scatter-plot of Kir fold differences (Kir-3 vs. WT-3) for all 319 Kir-regulated mRNAs against their circadian fold differences (WT-3 vs. WT-15). mRNAs up- and down-regulated by Kir are in orange red respectively. (C) Overlap of significantly regulated genes (p<0.01; FC>1.5) from 3 independent genomic experiments: WT-3 vs. WT-15 (red); NCB-15 vs. WT-15 (green); and Kir-3 vs. WT-3 (blue). (D) p-values of 336 NCB-regulated mRNAs (green) or 319 Kir-regulated mRNAs (orange) from the WT-3 vs. WT-15 comparison. See also Figure S1.
Figure 4
Figure 4. Molecular and circadian behavioral validation of electrically sensitive genes
(A) Wild-type larval LNvs were isolated at CT5, CT11, CT17 and CT23 and Kir or NCB expressing LNvs at CT11 and CT23 on day 2 in DD. RNA amplification and qPCR are described in Experimental Procedures, with 3 replicates for each condition except WT-17 (2 replicates) to measure expression of tim, per, Clk and cry. (B) qPCR as in A to analyze Nmdmc, Cbp53E, Tab2 and Pka-C1 expression. (C) tim(UAS)-Gal4 flies were crossed to 41 UAS-RNAi transformants with UAS-dcr-2 co-expressed to boost RNAi effectiveness. Group mean activity period (circle) with confidence interval are plotted. Non-overlapping intervals (red) are significantly different than control (blue), p<.05 (one-way ANOVA with post-hoc Tukey-Kramer multiple-comparison). (D) Representative actograms from single RNAi-expressing flies whose activity periods were significantly lengthened (MESR4 and Cbp53E), shortened (CdsA), or arrhythmic (AR, Pka-C1 and Rab2). Period shown is the group mean.
Figure 5
Figure 5. Creb family member protein levels are electrically sensitive and their over-expression alters circadian behavior
(A) Top: Control y w (Con) larval brains were dissected at ZT10 or ZT22. Pdf > NCB brains were dissected at ZT22 (NCB ZT22) and Pdf > Kir at ZT10 (Kir ZT10) and stained using antibodies to CrebA (green) and PDF (to mark LNvs, red). Bottom: red channel (PDF) removed from images in top panel. (B) As in A except that brains were stained with antibodies to CrebB (red) and PDF (green) at ZT11 and ZT23. (C) Top: quantification of CrebA immuno-staining in wildtype (y w) larval brains at four time points in LD. Each data point represents the average CrebA intensity (background corrected) from 5 brain hemispheres, normalized to peak. Bottom: quantification of CrebA in y w (Con), Pdf>Kir (Kir) and Pdf>NCB (NCB) larval brains at ZT10 and ZT22. (D) As in C except that CrebB immuno-staining was quantified. (E) Top left: Representative actograms of UAS-CrebA flies crossed to (from left to right): control y w flies (UAS-CrebA/+), flies with two copies of Pdf0.5-Gal4 (Pdf > CrebA), or tim(UAS)-Gal4 flies (tim > CrebA). Top right: Representative actograms of UAS-CrebB flies crossed to either y w flies (UAS-CrebB/+) or flies with two copies of Pdf0.5-Gal4 (Pdf > CrebB). Bottom: Representative actograms of UAS-Atf-2 flies crossed to either control y w flies (UAS- Atf-2/+), flies with two copies of Pdf0.5-Gal4 (Pdf > Atf-2) or tim(UAS)-Gal4 flies (tim > Atf-2). Periods shown are the group mean. See also Figure S2.

Comment in

Similar articles

Cited by

References

    1. Alberini CM. Transcription factors in long-term memory and synaptic plasticity. Physiol Rev. 2009;89:121–145. - PMC - PubMed
    1. Guan Z, Saraswati S, Adolfsen B, Littleton JT. Genome-wide transcriptional changes associated with enhanced activity in the Drosophila nervous system. Neuron. 2005;48:91–107. - PubMed
    1. Kim TK, Hemberg M, Gray JM, Costa AM, Bear DM, Wu J, Harmin DA, Laptewicz M, Barbara-Haley K, Kuersten S, et al. Widespread transcription at neuronal activity-regulated enhancers. Nature. 2010;465:182–187. - PMC - PubMed
    1. Deisseroth K, Bito H, Tsien RW. Signaling from synapse to nucleus: postsynaptic CREB phosphorylation during multiple forms of hippocampal synaptic plasticity. Neuron. 1996;16:89–101. - PubMed
    1. Flavell SW, Cowan CW, Kim TK, Greer PL, Lin Y, Paradis S, Griffith EC, Hu LS, Chen C, Greenberg ME. Activity-dependent regulation of MEF2 transcription factors suppresses excitatory synapse number. Science. 2006;311:1008–1012. - PubMed

Publication types

MeSH terms

Substances