. 2012 Oct;14(10):1079-88.
doi: 10.1038/ncb2568. Epub 2012 Sep 2.

Endocytosis of the seven-transmembrane RGS1 protein activates G-protein-coupled signalling in Arabidopsis

Affiliations

Endocytosis of the seven-transmembrane RGS1 protein activates G-protein-coupled signalling in Arabidopsis

Daisuke Urano et al. Nat Cell Biol. 2012 Oct.

Abstract

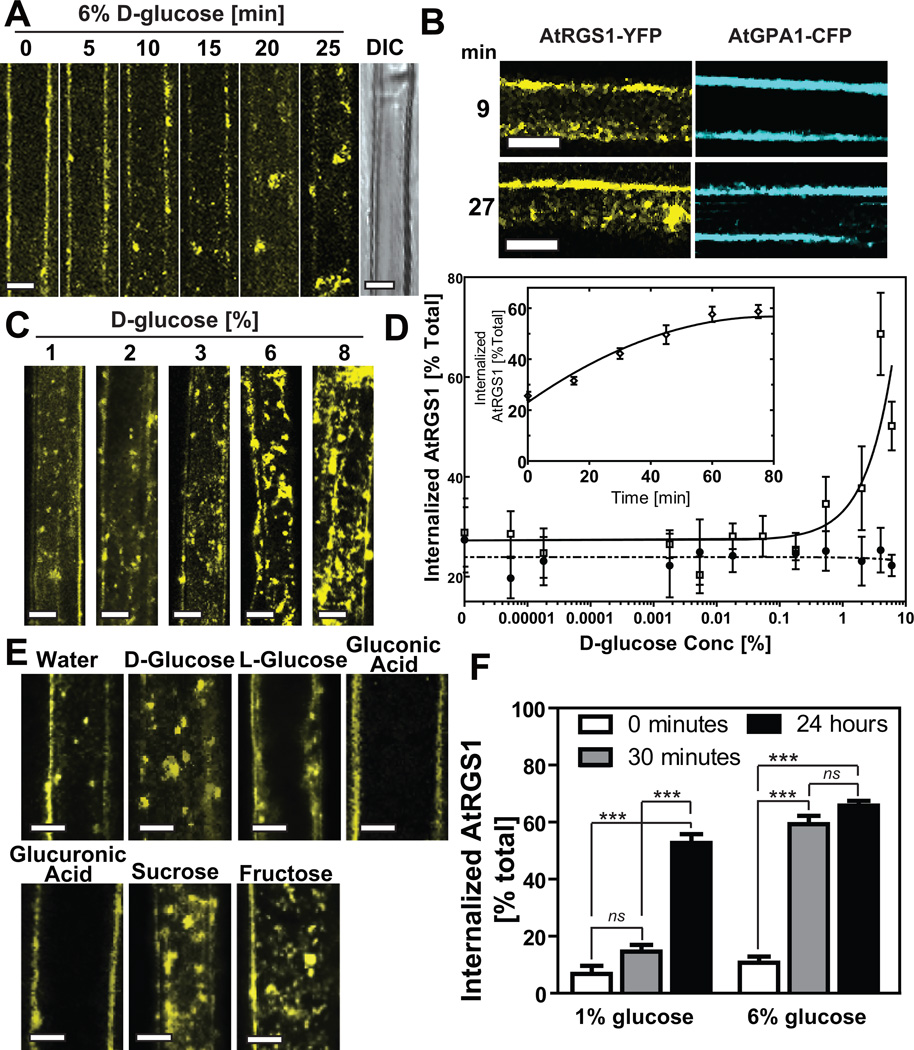
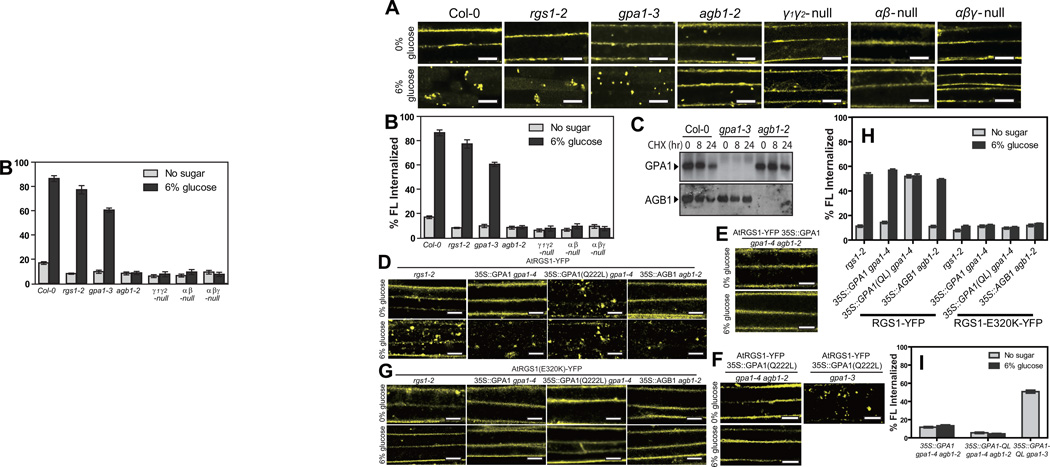
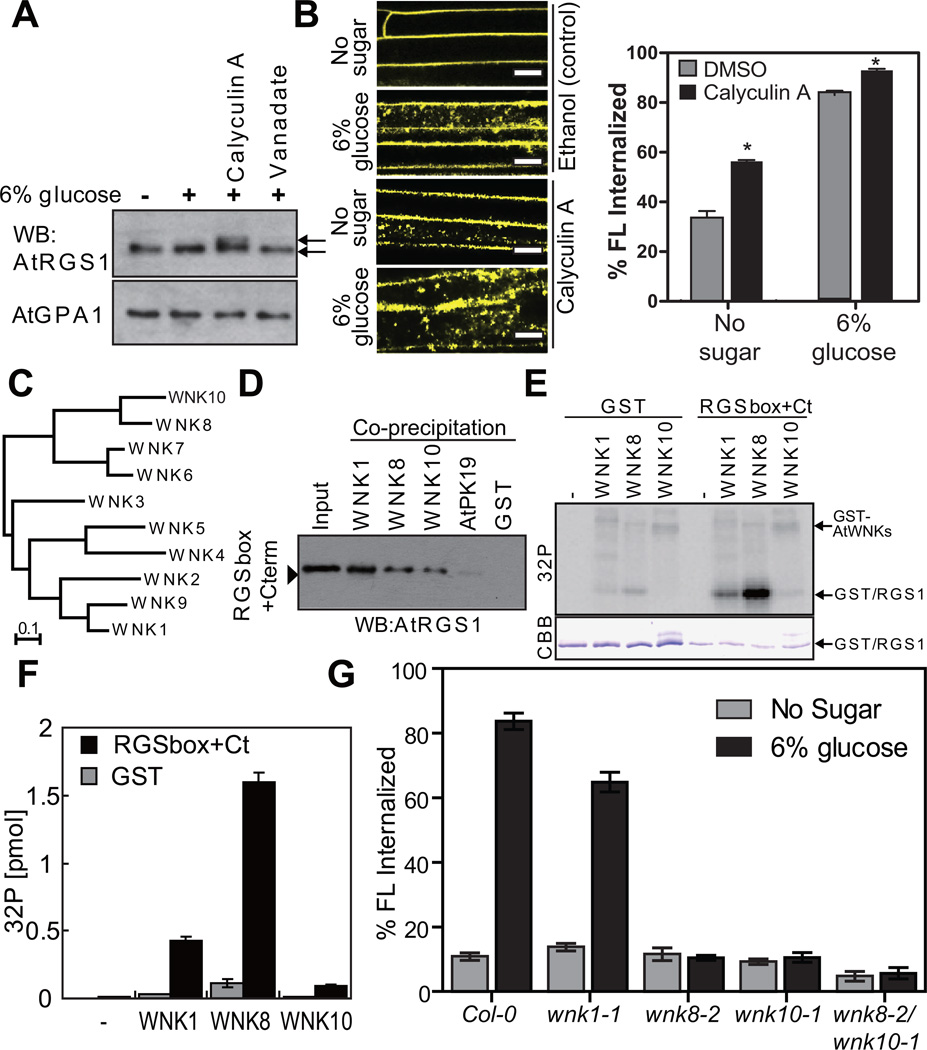
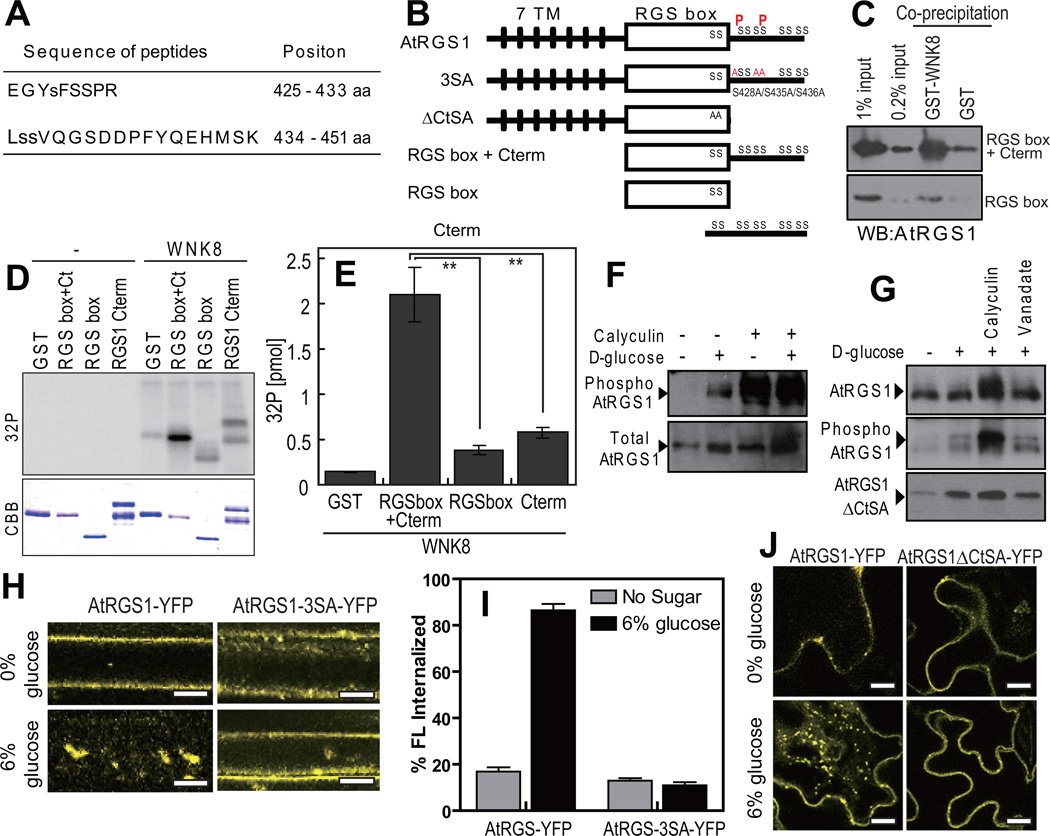
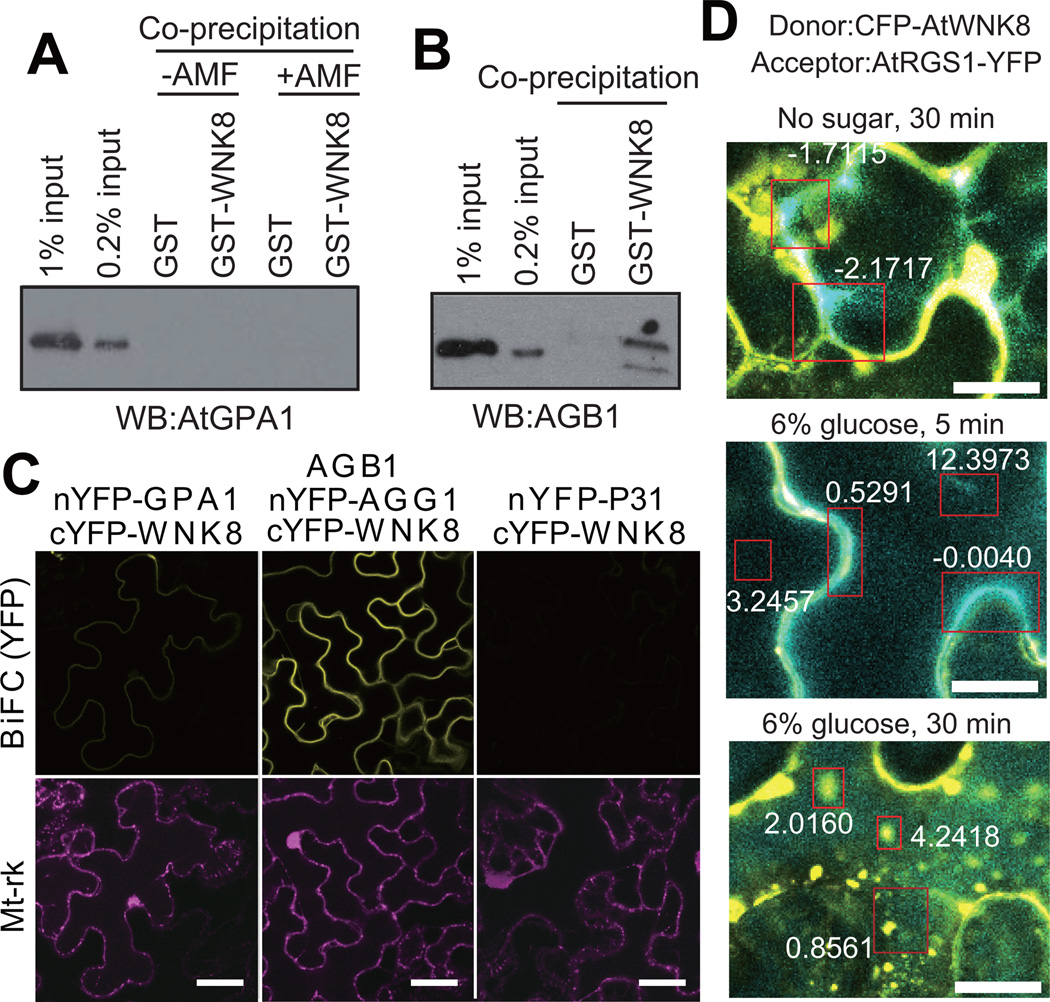
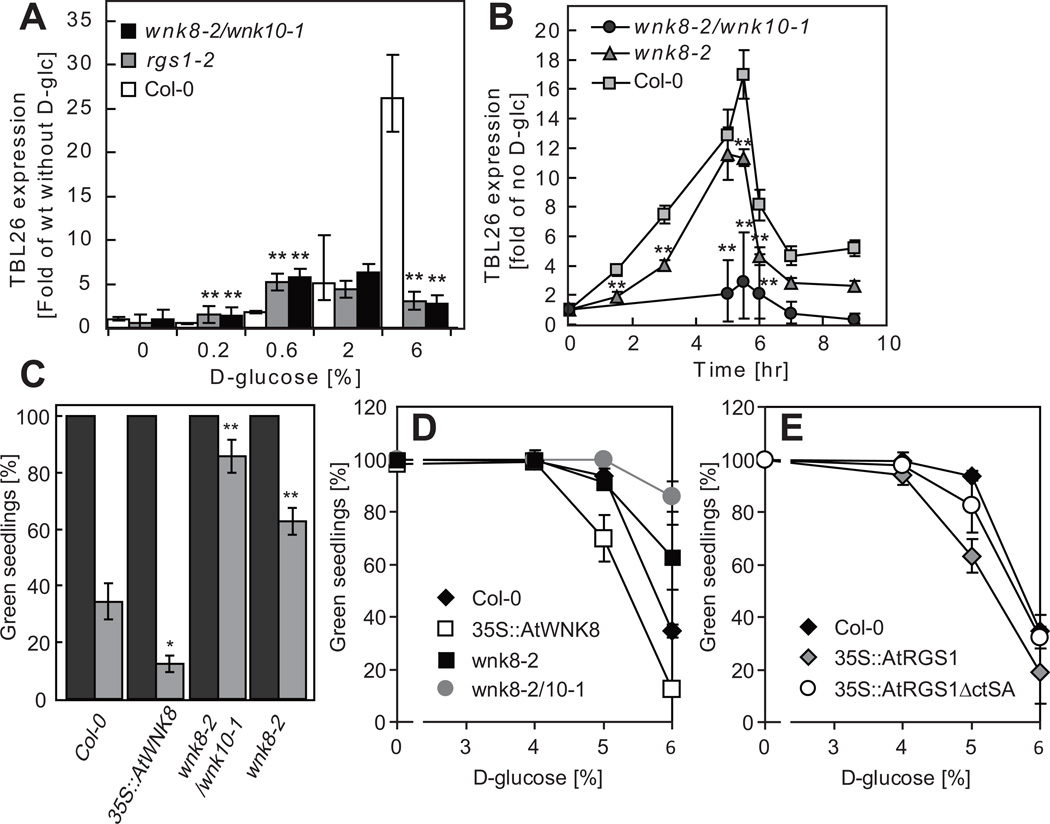
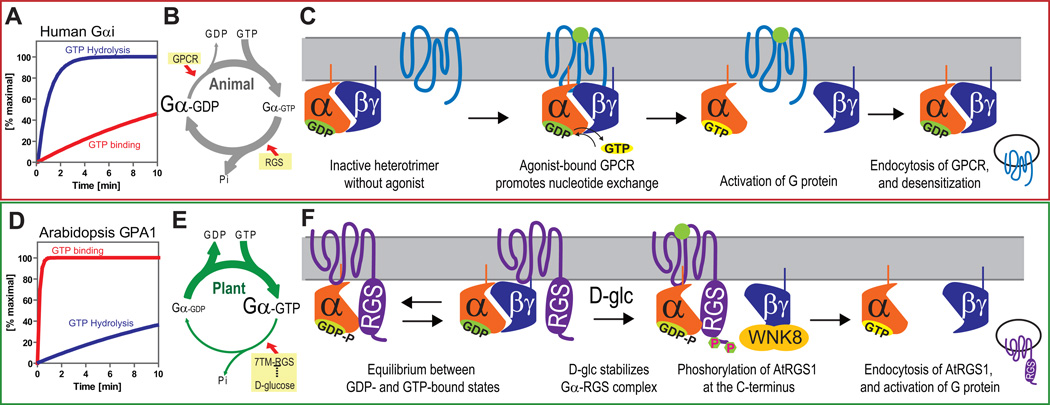
Signal transduction typically begins by ligand-dependent activation of a concomitant partner that is otherwise in its resting state. However, in cases where signal activation is constitutive by default, the mechanism of regulation is unknown. The Arabidopsis thaliana heterotrimeric Gα protein self-activates without accessory proteins, and is kept in its resting state by the negative regulator, AtRGS1 (regulator of G-protein signalling 1), which is the prototype of a seven-transmembrane receptor fused with an RGS domain. Endocytosis of AtRGS1 by ligand-dependent endocytosis physically uncouples the GTPase-accelerating activity of AtRGS1 from the Gα protein, permitting sustained activation. Phosphorylation of AtRGS1 by AtWNK8 kinase causes AtRGS1 endocytosis, required for both G-protein-mediated sugar signalling and cell proliferation. In animals, receptor endocytosis results in signal desensitization, whereas in plants, endocytosis results in signal activation. These findings reveal how different organisms rearrange a regulatory system to result in opposite outcomes using similar phosphorylation-dependent endocytosis mechanisms.


Figures

Figure 1
Figure 1. AtRGS1 internalizes in response to sugar
AtRGS1-YFP internalized by glucose. (A) AtRGS1-YFP and (B) AtGPA1-CFP localization after treatment with 6% glucose in an Arabidopsis hypocotyl epidermal cell. Differential interference contrast (DIC) shows that 30 min of glucose does not disrupt cell integrity (last in series, panel A). (C) Dose-dependent internalization of AtRGS1. Arabidopsis cells stably expressing AtRGS1-YFP imaged after treatment with varying concentrations of glucose for 30 min. (D) Quantitation of dosage response of AtRGS1 (open square) and AtRGS1(E320K) mutant (GAP dead; close circle) with increasing glucose concentrations. At the 30 min time point, YFP fluorescence was measured by subtracting internalized RGS1-YFP fluorescent signal from total cell fluorescence. A point mutation that inhibits AtRGS1 interaction with AtGPA1, AtRGS1(E320K), disrupts AtRGS1-YFP internalization. Error bars = SEM, n = 5. (D Inset) Quantitation of the glucose dosage response of AtRGS1-YFP internalization imaged at 30 min post-glucose treatment. Error bars = SEM, n = 5. (E) Sugar specificity of AtRGS1 internalization. Several sugar and sugar analogs (6% of each) were applied to seedlings expressing AtRGS1-YFP for 30 min prior to imaging as described in Methods. (F) RGS1-YFP reciprocity of time and dose dependence. AtRGS1 seedlings stably expressing AtRGS1-YFP were treated without or with 1% or 6% D-glucose. After 30 min or 24 hr treatment, internalized AtRGS1 was quantified. Error = SEM, n = 5. Labels with ns has no statistical difference (P > 0.05), *** mean highly significantly different (P < 0.001). All scale bars = 10 µm. Quantitation of fluorescence is described in Methods.
Figure 2
Figure 2. AGB1 is essential for AtRGS1 internalization
(A) AtRGS1-YFP was transiently expressed in an informative set of G-protein mutants and treated with 6% glucose. Internalization of AtRGS1-YFP was imaged in Col-0, rgs1-2, gpa1-3, agb1-2, gpa1-4 agb1-2 double null mutants (αβ-null) and gpa1-4 agb1-2 agg1-2 agg2-1 quadruple null mutants (αβγ-null) without and with 6% glucose. (B) Quantitation of percent AtRGS1-YFP fluorescence (FL) internalized in epidermal cells transiently expressed before and after glucose stimulation. Error bars = SEM, n = 5. (C) Seedlings of Col-0, gpa1-3 and agb1-2 were treated with 200 mM cycloheximide (CHX). Relative steady-state levels of AtGPA1 and AGB1 protein in the seedling were analyzed by immunoblot analysis with anti-AtGPA1 and anti-AGB1 antisera. (D) AtRGS1-YFP was transiently expressed in rgs1-2 null mutants, 35S::AtGPA1, 35S::AtGPA1(Q222L) (active mutant) or 35S::AGB1 lines and treated with 6% glucose. “35S::” represents a constitutive promoter from the Cauliflower Mosaic virus used for ectopic overexpression. (E) AtRGS1-YFP and 35S::AtGPA1 were transiently expressed in a gpa1-4 agb1-2 double mutant and treated with 6% glucose. (F) Both AtRGS1-YFP and 35S::AtGPA1(Q222L) were transiently expressed in the gpa1-4 agb1-2 double mutant and treated with 6% glucose (left panels). AtRGS1-YFP and 35S::AtGPA1(Q222L) were also transiently expressed in the gpa1-3 mutant (right panel). (G) AtRGS1(E320K)-YFP was transiently expressed in rgs1-2 null mutants, 35S::AtGPA1, 35S::AtGPA1(Q222L) (active mutant) or 35S::AGB1 lines then treated with 6% glucose prior to imaging.(H) Quantitation of percent AtRGS1-YFP and AtRGS1-E320K-YFP fluorescence internalized in epidermal cells before and after 6% glucose stimulation. Error bars = SEM, n = 5. The genetic background is indicated: rgs1-2, ectopic expression of AtGPA1 (35S-GPA1 in gpa1-4 null background), ectopic expression of constitutively-active AtGPA1 (35S::GPA1(Q222L) in gpa1-4 null background), and ectopic expression of AGB1 (35S::AGB1 in agb1-2 null background). (I) Quantitation of percent of AtRGS1-YFP fluorescence in epidermal cells transiently expressing the AtGPA1 in the gpa1/agb1 double mutant (35S::AtGPA1 in gpa1-4 agb1-2 null background), constitutively-active AtGPA1 (35S::GPA1-QL) in the gpa1/agb1 double mutant), and 35S::GPA1-QL in the gpa1-3 mutant). Error = SEM, n = 5.All scale bars = 10 µm. GPA1-QL represents GPA1(Q222L). Quantitation of fluorescence is described in Methods.
Figure 3
Figure 3. In vivo and In vitro function of AtWNK8
(A) In vivo phosphorylation of AtRGS1. Seedlings expressing AtRGS1-TAP were pretreated with 100 nM calyculin A and 10 mM sodium orthovanadate for 3 h followed by 6% D-glucose stimulation for 90 min. AtRGS1-TAP or AtGPA1 in seedling lysates was separated on a 12.5% Anderson’s gel and detected by immunoblot with peroxidase anti-peroxidase or anti-AtGPA1 antibody. (B) Four-day-old AtRGS1-YFP expressing seedlings were treated with phosphatase inhibitors, calyculin A, for 2 h followed by 6% glucose treatment or not (No glucose) for 1 h prior to imaging epidermal cells. Scale bars = 10 µm. Error = SEM, n = 5. (C) Phylogenetic tree of the AtWNK-family kinases. Full-length amino acid sequences were aligned with CLUSTAL W implemented in CLC Genomics Workbench using the following settings; Gap open penalty, 10; Gap extension penalty 1. The neighbor joining tree (1000 bootstrap replicate) was created with the aligned sequences. (D) In vitro binding between AtRGS1 and AtWNKs. Recombinant RGSbox+Cterm was tested for interaction with GST (negative control) or GST-AtWNKs using glutathione-Sepharose, and detected by immunoblot analysis using an anti-AtRGS1 antibody. (E) In vitro phosphorylation of AtRGS1 by AtWNK kinases. Recombinant GST or His-RGSbox+Cterm was incubated with GST-AtWNKs in reaction buffer containing γ32P-ATP. Proteins were separated on SDS-PAGE. (F) Radioactivity incorporated into the GST/RGS1 bands. Phosphorylation levels of three independent experiments were quantified in (E). Error bars = SEM. (G) Quantitation of sugar-induced AtRGS1 internalization in AtWNK-null mutants. Seedlings of Col-0, wnk1-1, wnk8-1, wnk8-2 or wnk10-2 transiently expressing AtRGS1-YFP were treated with 6% D-glucose for 30 min. WNK# denotes AtWNK members in panels C-F. Error bars = SEM, n = 5. Quantitation of fluorescence is described in Methods.
Figure 4
Figure 4. Phosphorylation and function of the carboxyl terminus of AtRGS1
(A) Phosphorylated peptides of AtRGS1 isolated and identified by tandem mass spectrometry. Recombinant RGSbox+Cterm was phosphorylated by AtWNK8, trypsinized and subjected to LC-MS/MS as described in the Methods. (B) Schematic model of AtRGS1 mutants. Transmembrane regions are shown as black lines, AtRGS1 box as a white box and the identified phosphorylation sites are denoted “P”. (C) In vitro binding between AtRGS1 truncated mutants and AtWNK8. Recombinant RGSbox+Cterm or RGSbox of AtRGS1 was tested for interaction with GST (negative control) or GST-AtWNK8. Inputs and precipitated proteins were analyzed by immunoblot analysis using an anti-AtRGS1 antibody. (D) In vitro phosphorylation of AtRGS1 by AtWNK8. Recombinant His-tagged RGSbox+Cterm, RGSbox, or GST-AtRGS1-Cterm plus γ32P-ATP were incubated with (WNK8) or without (−) GST-AtWNK8. Radiolabelled (32P) proteins were separated by SDS-PAGE and detected as described in the Methods. (E) The levels of phosphorylation were quantified. Error bars = SEM, n = 3. **, P < 0.01. (F) In vivo phosphorylation of AtRGS1. Seedlings expressing AtRGS1-TAP were pretreated with 100 nM calyculin A for 3 h followed by 6% D-glucose for 90 min. Phosphorylation of AtRGS1 was detected by immunoblot analysis using an anti-phospho-AtRGS1 antibody or peroxidase anti-peroxidase (Total RGS1). (G) In vivo phosphorylation of AtRGS1 or the ΔCtSA mutant. TAP-tagged AtRGS1 or AtRGS1-ΔCtSA seedlings were pretreated with 100 nM calyculin A or 10 mM sodium orthovanadate for 3 h followed by 6% D-glucose stimulation for 90 min. AtRGS1 or AtRGS1-ΔCtSA lysates was separated by 12.5% Anderson’s gel and subjected to immunoblot analysis using anti-phospho-AtRGS1 antibody or peroxidase anti-peroxidase (Total RGS1, RGS1ΔCtSA). (H) Internalization of AtRGS1-YFP and AtRGS1-3×SA-YFP. AtRGS1-YFP and AtRGS1-3×SA-YFP were transiently expressed, followed by 30 min treatment in 6% glucose prior to imaging. Scale bars = 10 µm. (I) Quantitation of AtRGS1-YFP and AtRGS1-3×SA-YFP fluorescence internalization. Error = SEM, n = 5. (J) Internalization of full-length and carboxyl-terminal truncated mutant of AtRGS1. AtRGS1-YFP or AtRGS1-ΔCtSA was expressed in tobacco leaves and treated with 6% D-glucose for 30 min. WNK8 denotes AtWNK8. Scale bars = 20 µm. Quantitation of fluorescence is described in Methods.
Figure 5
Figure 5. AtWNK8 physically interacts with the G-protein βγ subunit
(A, B) In vitro binding between AtWNK8 and heterotrimeric G protein. Inactive, GDP-bound AtGPA1, AtGPA1 activated by aluminum tetrafluoride (AMF: 50 µM GDP, 30 µM AlCl3, 10 mM MgCl2 and 5 mM NaF) or AGB1/AGG1 was co-precipitated with GST or GST-AtWNK8. Proteins were subjected to immunoblot analysis with anti-AtGPA1 or anti-AGB1 antisera. The two different amounts of input protein (0.2% or 1% of total) were loaded as reference. (C) In vivo binding between AtWNK8 and heterotrimeric G protein. nYFP-tagged AtGPA1, AGG1 with AGB1, or P31 was co-transformed with cYFP-tagged AtWNK8 and mitochondrial marker (Mt-rk, transformation control) into tobacco leaves. Fluorescence complementation of split YFP and expression of RFP were observed by confocal fluorescence microscopy. Scale bars = 50 µm. (D) CFP-AtWNK8 associates with AtRGS1-YFP. Acceptor photobleaching of CFP-AtWNK8 and AtRGS1-YFP transiently expressed in tobacco in no sugar and 6% D-glucose for the indicated times. Bleached zones are in red boxes and numbers denote the net FRET value. WNK8 denotes AtWNK8. The method for determining the FRET efficiency indicated by the respective boxes is described in the Methods. Scale bars = 20 µm.
Figure 6
Figure 6. wnk8 mutant expression and phenotypes
(A) Glucose signaling as reported by gene expression analysis in wnk mutants. Dose-dependent TBL26 expression in Col-0, rgs1-2 or wnk8-2/wnk10-1. 7-day old seedlings were starved for 2 days and then treated with various concentration of D-glucose for 3 h. TBL26 transcript levels were normalized with that of Col-0 without D-glucose stimulation. Data shows mean ± S.D. (n = 3) from a representative experiment. (B) Time course of TBL26 expression and the reset timing. Seedlings were starved for 2 days and either stimulated with 6% D-glucose for 5 h or not (by moving to ½ X MS media lacking sugars). TBL26 expressions at each time period were normalized with the expression without D-glucose stimulation. Data shows mean ± S.D. (n = 3) from a representative experiment. (C, D, E) Physiological sugar-related phenotype of wnk and rgs1 mutants. Vernalized seeds of wild type col-0 or the indicated mutants were grown on ½ X MS plates containing 0%, 3%, 4%, 5% and 6% D-glucose at 23° C under continuous light (50 µmol s−1 m−2) for 10 days. The average number of seedlings having green cotyledons were determined and presented with SEM. The histogram in C provides the average plus SEM of 0% glucose (black) or 6% D-glucose (gray). Error bars = SEM. Pairwise Student’s t test was used to compare values to the Col-0. *, P < 0.05; **, P < 0.01. “35S::” represents a constitutive promoter from the Cauliflower Mosaic virus used here for ectopic overexpression of the indicated open reading frame. n (the number of independent experiments) = 2 for 0%, 4 for 6% or 3 for the other concentration of D-glucose.
Figure 7
Figure 7. Model of sustained G protein activation in Arabidopsis; comparison of activation mechanisms between fast and slow nucleotide exchanging G proteins
(A, D) Rate of guanine nucleotide exchange of human G protein is slower than that of GTP hydrolysis. However, Arabidopsis AtGPA1 rapidly releases GDP, while GTP hydrolysis is slow. (B, E) Based on these intrinsic properties, human G proteins require GPCRs to form the active GTP-bound state. In contrast, AtGPA1 requires a constitutively active 7TM-RGS protein, AtRGS1, to keep the inactive GDP-bound state. Genetic evidence suggests that D-glucose inhibits AtRGS1 to activate the Arabidopsis G protein pathway. (C, F) Many human GPCRs are endocytosed after phosphorylation and subsequent endocytosis causes desensitization of G protein signaling. In Arabidopsis, in the absence of glucose, Gα subunit binding is in equilibrium between the RGS and Gβ dimerization interfaces, both shared on the Gα subunit. Glucose shifts the equilibrium toward the Gα-RGS dimer increasing the time the Gβγ remains free from the heterotrimer. The free Gβγ dimer recruits AtWNK8 to phosphorylate AtRGS1 at its C terminus. Phosphorylation is requisite for AtRGS1 endocytosis. Endocytosis causes uncoupling of AtGPA1 from its inhibitor, AtRGS1 and subsequent sustained activation of G protein signaling.

Similar articles

Cited by

References

    1. Kohout TA, Lefkowitz RJ. Regulation of G protein-coupled receptor kinases and arrestins during receptor desensitization. Mol Pharmacol. 2003;63:9–18. - PubMed
    1. Hanyaloglu AC, von Zastrow M. Regulation of GPCRs by endocytic membrane trafficking and its potential implications. Annu Rev Pharmacol Toxicol. 2008;48:537–568. - PubMed
    1. Johnston CA, et al. GTPase acceleration as the rate-limiting step in Arabidopsis G protein-coupled sugar signaling. Proc Natl Acad Sci U S A. 2007;104:17317–17322. - PMC - PubMed
    1. Urano D, et al. G Protein Activation without a GEF in the Plant Kingdom. PLoS Genet. 2012;8:e1002756. - PMC - PubMed
    1. Gookin TE, Kim J, Assmann SM. Whole proteome identification of plant candidate G-protein coupled receptors in Arabidopsis, rice, and poplar: computational prediction and in-vivo protein coupling. Genome Biol. 2008;9:R120. - PMC - PubMed

Publication types

MeSH terms