. 2012 Oct;15(10):1414-21.
doi: 10.1038/nn.3209. Epub 2012 Sep 2.

Calcium entry induces mitochondrial oxidant stress in vagal neurons at risk in Parkinson's disease

Affiliations

Calcium entry induces mitochondrial oxidant stress in vagal neurons at risk in Parkinson's disease

Joshua A Goldberg et al. Nat Neurosci. 2012 Oct.

Abstract

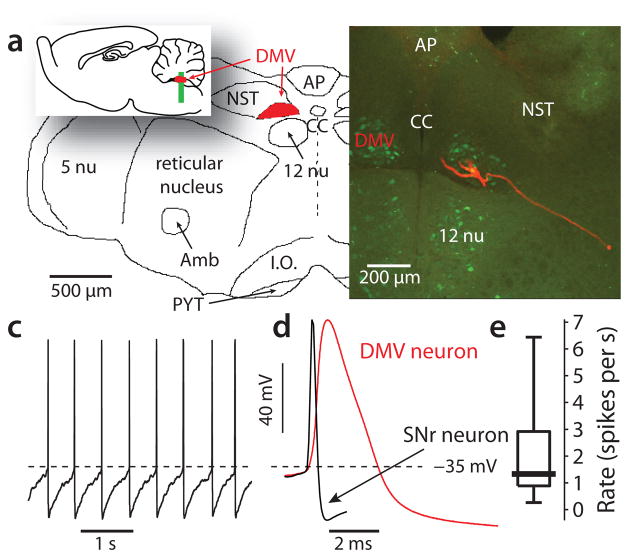
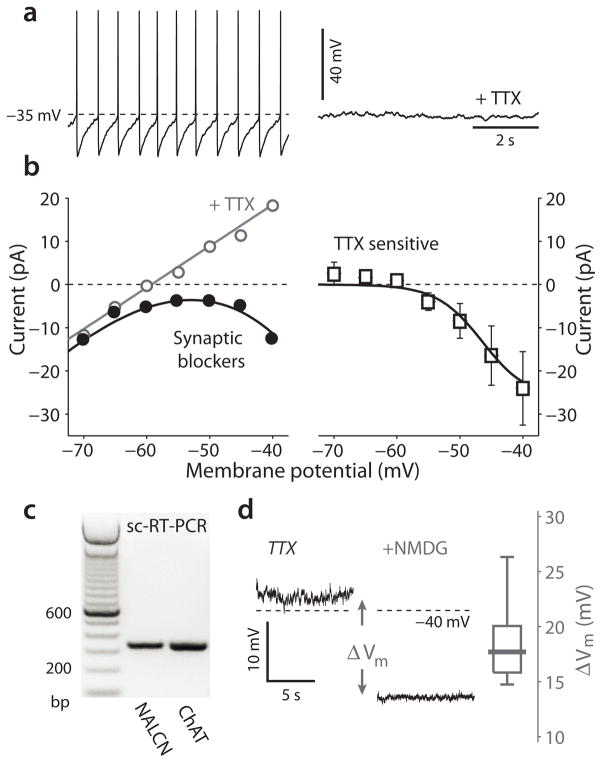
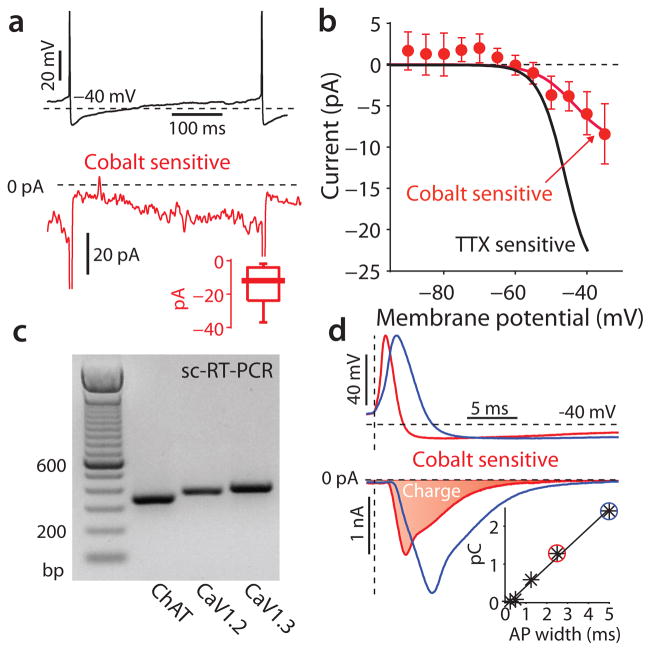
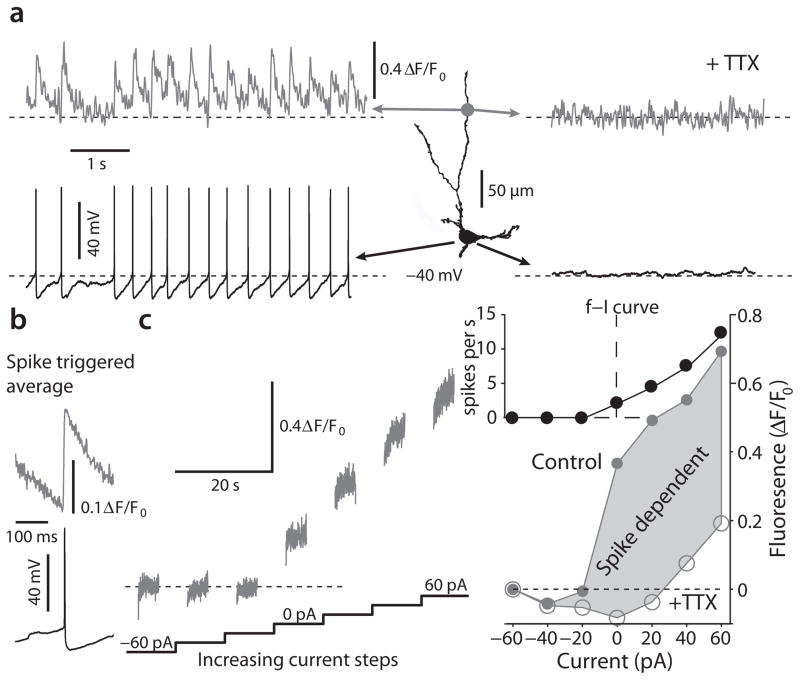
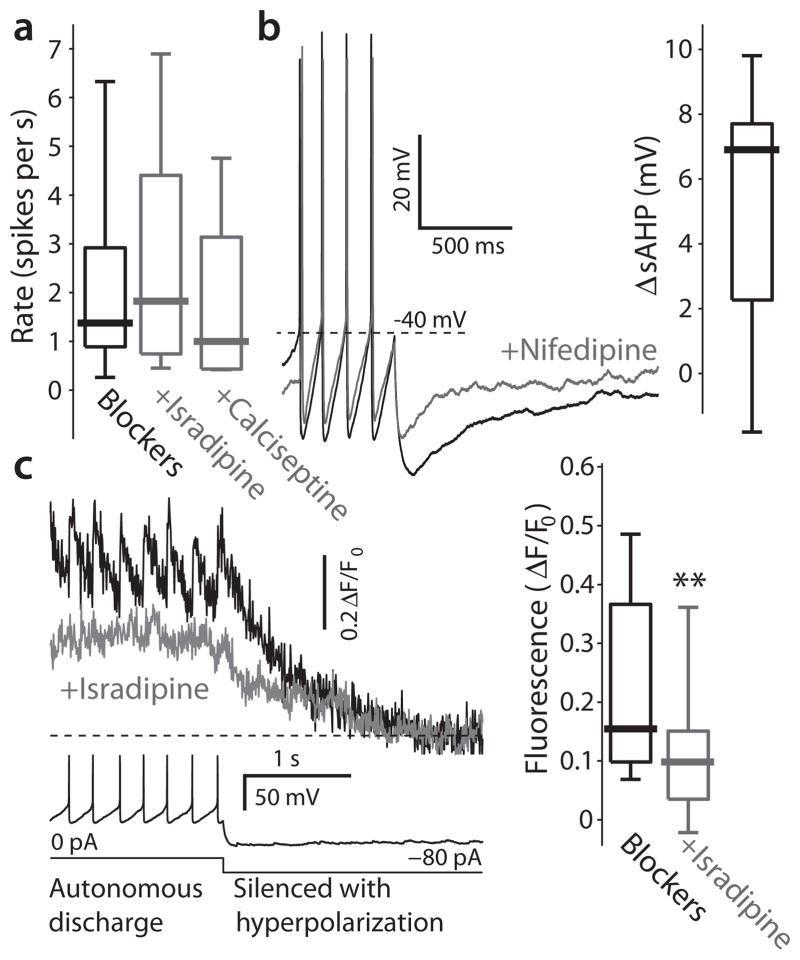
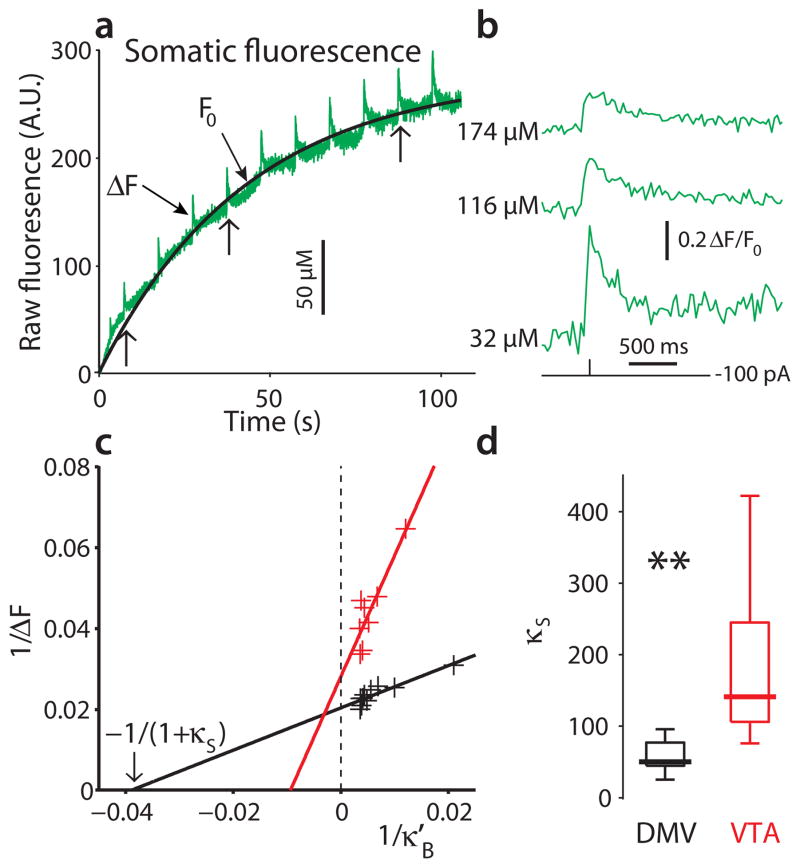
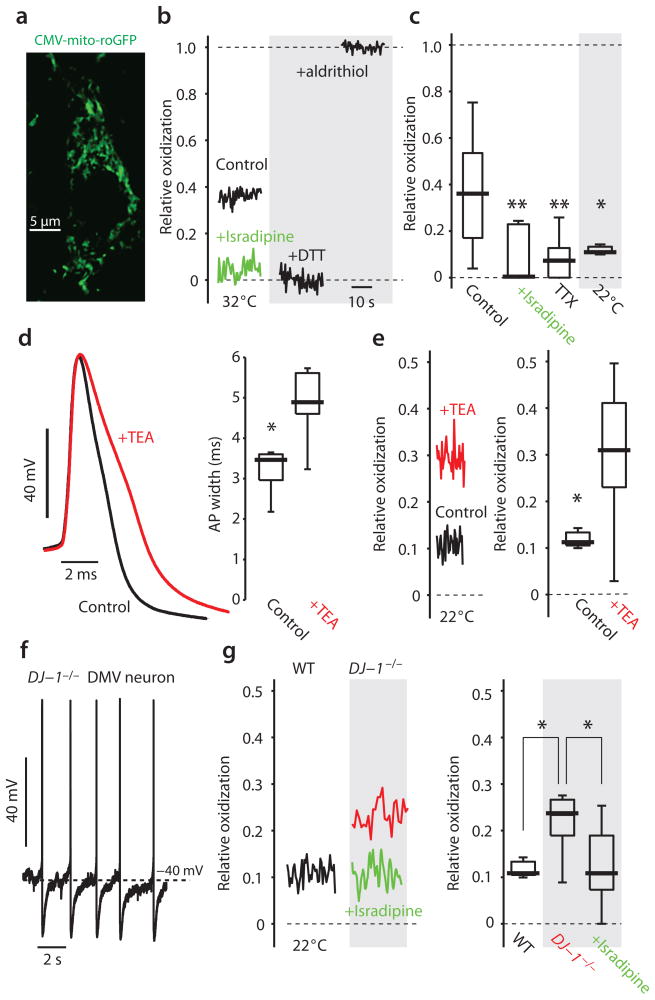
Mitochondrial oxidant stress is widely viewed as being critical to pathogenesis in Parkinson's disease. But the origins of this stress are poorly defined. One possibility is that it arises from the metabolic demands associated with regenerative activity. To test this hypothesis, we characterized neurons in the dorsal motor nucleus of the vagus (DMV), a population of cholinergic neurons that show signs of pathology in the early stages of Parkinson's disease, in mouse brain slices. DMV neurons were slow, autonomous pacemakers with broad spikes, leading to calcium entry that was weakly buffered. Using a transgenic mouse expressing a redox-sensitive optical probe targeted to the mitochondrial matrix, we found that calcium entry during pacemaking created a basal mitochondrial oxidant stress. Knocking out DJ-1 (also known as PARK7), a gene associated with early-onset Parkinson's disease, exacerbated this stress. These results point to a common mechanism underlying mitochondrial oxidant stress in Parkinson's disease and a therapeutic strategy to ameliorate it.


Conflict of interest statement

Competing financial interests

The authors declare no competing financial interests.

Figures

Figure 1
Figure 1
Autonomous discharge in cholinergic neurons of the dorsal motor nucleus of the Vagus (DMV). (a) the DMV is located in the medulla oblongata dorsal to the hypoglossal nucleus (12 nu) and lateral to the central canal (CC). inset: sagittal view. Abbreviations: 5 nu – trigeminal nucleus, Amb – nucleus ambiguus, AP – area postrema, I.O. – inferior olive, NST – nucleus of the solitary tract, PYT – pyramidal tract. (b) a confocal image of a transverse slice of the medulla from a ChaT-eGFP mouse (approximate location indicated in inset of panel a). Bilateral DMV can be seen lateral to the central canal and dorsal to the hypoglossal nucleus. The overwhelming majority of neurons in the DMV are ChAT positive. One such cell was filled with biocytin and reacted with streptavidin-Alexafluor 594. Dendrites and a ventrolaterally coursing axon are visible. (c) perforated patch recording of the autonomous discharge in a DMV neuron in the presence of a cocktail of synaptic blockers. (d) waveform of an spike of a DMV neuron (red). An spike from a GABAergic neuron of the substantia nigra pars reticulata (SNr) is shown for comparison (black). (e) distribution of the autonomous firing rates of DMV neurons in the presence of the blockers.
Figure 2
Figure 2
Role of sodium currents in the pacemaking of cholinergic DMV neurons. (a) a perforated patch recording from a cholinergic DMV neuron during pacemaking in the presence of a cocktail of synaptic blockers before and after application of 1 μM tetrodotoxin (TTX). (b) left: steady-state I-V curve of a DMV neuron before (black) and after (gray) TTX application. right: population average (mean ± sem) of the persistent TTX sensitive currents. Solid line: fit of a Boltzman sigmoidal curve for conductance multiplied by an electromotive force with a sodium Nernst potential of +70 mV, which is the predicted empirical potential. (c) single-cell reverse transcription PCR (sc-RT-PCR) reveals the presence of the NALCN channel mRNA in 6/10 of the cholinergic in DMV neurons. (d) recording of the TTX-induced stable resting potential before and after total sodium replacement with N-methyl-D-glucamine (NMDG) reveals a large hyperpolarization. The distribution of NMDG-induced hyperpolarizations (ΔVm) is shown on the right.
Figure 3
Figure 3
Calcium currents during the pacemaking cycle in DMV neurons. (a) cobalt-sensitive calcium currents recorded (bottom) in response to a voltage clamped spike waveform recorded from a DMV neuron (top). Inset: distribution of the cobalt-sensitive subthreshold calcium current measured prior to the spike. (b) population average (mean ± sem) of the persistent cobalt-sensitive calcium currents as a function of voltage. Solid red line is a fit as in Fig. 2c, but with a calcium Nernst potential of +120 mV. The fit for the TTX sensitive current from Fig. 2c is shown in black for comparison. (a) single-cell reverse transcription PCR (sc-RT-PCR) reveals the presence of mRNA for Cav1.2 and Cav1.3 channels in DMV cholinergic neurons (in 7/8 and 3/8 cells, respectively). (d) cobalt-sensitive calcium action currents generated by a physiological spike (red) and one expanded to twice the duration (blue). Vertical dashed line is the time of spike threshold, as determined by maximal dV/dt. Inset: calcium charge (=shaded area) as a function of spike duration.
Figure 4
Figure 4
2PLSM calcium imaging demonstrates that calcium dynamics are dominated by spike associated influx. (a) Left: Somatic voltage recording and 2PLSM Fluo-4 imaging from a distal dendritic location (140 μm from soma) of a DMV cell reveal spontaneous discharge that is accompanied by spike associated calcium transients. Right: Application of TTX reveals a stable resting potential without any subthreshold calcium oscillations. (b) spike triggered average of calcium transients in a DMV neuron reveal a rapid increase in calcium that is followed by an exponential decay. (c) Left: 2PLSM calcium imaging from the soma in response to a sequence of 10-s current injections from −60 pA to +60 pA to either hyperpolarize and silence discharge or to depolarize and increase discharge. The value of fluorescence for 0 pA is defined as the ambient fluorescence. Right: bottom – the plot of fluorescence as a function of current before (filled circles) and after (empty circles) TTX treatment demonstrates that the majority of calcium entry is spike-dependent. At the population level, the rise in free calcium as a function of applied current, estimated from the slope of this function from −20 to +60 pA, decreased significantly in TTX (not shown, n = 6 cells, P < 0.05, SRT). top – frequency-intensity (f–I) curve of this neuron in response to the same current steps.
Figure 5
Figure 5
Contribution of Cav1 channels to discharge patterns and ambient calcium levels in DMV neurons. (a) Preincubation in 200 nM of either isradipine or calciseptine, that antagonize Cav1 channels, does not alter the distribution of DMV neurons firing rates. (b) Application of 5 μM nifedipine, a Cav1 channel antagonist, significantly reduced the depth of the slow afterhyperpolarization (sAHP), measured from spike threshold, that follows long depolarizing pulses. Inset: distribution of changes in sAHP amplitude (ΔsAHP) in response to this drug. (c) Left: recording of spontaneous discharge followed by a hyperpolarizing pulse to silence the cell (bottom) can be used to measure the ambient fluorescence during autonomous discharge (top). Treatment with 5 μM isradipine consistently reduces the baseline level of fluorescence in cholinergic DMV neurons. Right: distribution of ambient levels of fluorescence before and after treatment with 5 μM isradipine ** P < 0.01, SRT.
Figure 6
Figure 6
DMV neurons have a low endogenous buffering capacity relative to dopaminergic VTA neurons. (a) Raw fluorescence as a function of time (green). Brief depolarizing pulses (2 nA, 2 ms) are delivered every 10 s for 2 min to induce an spike as the cell fills with the Fluo-4 indicator. These spikes are accompanied by brief steps in raw fluorescence (ΔF). Prior to these pulses and between them the cell is silenced with a constant hyperpolarizing current. Fitting an exponential curve to the temporal profile of basal fluorescence (F0), can be used to estimate the cytosolic concentration of the Fluo-4 dye as a function of time (black). A.U. – arbitrary units. (b) Spike induced transients in free cytosolic calcium concentration, measured with ΔF/F0, decrease and get prolonged as the concentration of the added buffer increases (data excised from around the points marked with vertical arrows in panel a). (c) Fitting a linear regression line to the scatter plot of the reciprocal of ΔF as a function of the reciprocal of the incremental buffering capacity κ′B (see Online Methods) for one DMV neuron (black) and one dopaminergic neuron of the ventral tegmental area (VTA, red) yields estimates of the endogenous buffering capacity (κS) in these cells. (d) the distribution of κS for both populations is shown on the right, demonstrating that the buffering capacity of DMV neurons is significantly smaller than that of dopaminergic VTA neurons (** P < 0.005, RST).
Figure 7
Figure 7
Mitochondria in DMV neurons are normally oxidized and are reduced by preincubation in isradipine. (a) A confocal image of the soma and proximal dendrite of a DMV neuron from a CMV-mito-roGFP mouse. (b) The relative oxidization is estimated by measuring the resting fluorescence of the mitochondria relative to post-treatment with strong reducing (dithiothreitol, DTT) and oxidizing (aldritihiol) agents. Preincubation in 200 nM isradipine reduces the cells (green). (c) DMV neurons exhibit a broad range of relative oxidization. Pre-incubation in 200 nM isradipine or 1 μM TTX reduces the mitochondria matrix proteins, as does lowering the bath temperature to 22 °C. (d) bath application of 0.5 mM TEA significantly and reversibly (not shown) broadened the spike in every DMV neurons recorded. (e) Pre-incubation in 0.5 mM TEA significantly oxidized the mitochondria (red). (f) Autonomous discharge of a DMV neuron from CMV-mito-roGFP mice lacking the DJ-1 gene (DJ-1−/−). (g) The basal oxidation of mitochondrial matrix proteins was significantly higher in DJ-1−/− mice. Pre-incubation in 200 nM isradipine significantly reduced the mitochondria of DMV cells in these animals. ** P <0.01, * P < 0.05, RST.

Comment in

Similar articles

Cited by

References

    1. de Lau LM, Breteler MM. Epidemiology of Parkinson’s disease. Lancet Neurol. 2006;5:525–535. - PubMed
    1. Biskup S, Moore DJ. Detrimental deletions: mitochondria, aging and Parkinson’s disease. Bioessays. 2006;28:963–967. - PubMed
    1. Lees AJ, Hardy J, Revesz T. Parkinson’s disease. Lancet. 2009;373:2055–2066. - PubMed
    1. Schapira AH. Mitochondria in the aetiology and pathogenesis of Parkinson’s disease. Lancet Neurol. 2008;7:97–109. - PubMed
    1. Albin RL, Young AB, Penney JB. The functional anatomy of disorders of the basal ganglia. Trends Neurosci. 1995;18:63–64. - PubMed

Publication types