

doi: 10.1038/nn.3210.
Epub 2012 Sep 2.
Saccadic eye movements evoked by optogenetic activation of primate V1
Affiliations
- PMID: 22941109
- PMCID: PMC3458167
- DOI: 10.1038/nn.3210
Item in Clipboard
Saccadic eye movements evoked by optogenetic activation of primate V1
Nat Neurosci.
2012 Oct.
Abstract
Optogenetics has advanced our understanding of the neural basis of simple behaviors in rodents and small animals. In primates, however, for which more sophisticated behavioral assays exist, optogenetic manipulations of behavior have been unsuccessful. We found that monkeys reliably shifted their gaze toward the receptive field of optically driven channelrhodopsin-2-expressing neurons of the primary visual cortex. This result establishes optogenetics as a viable tool for the causal analysis of behavior in primate brain.
Figures
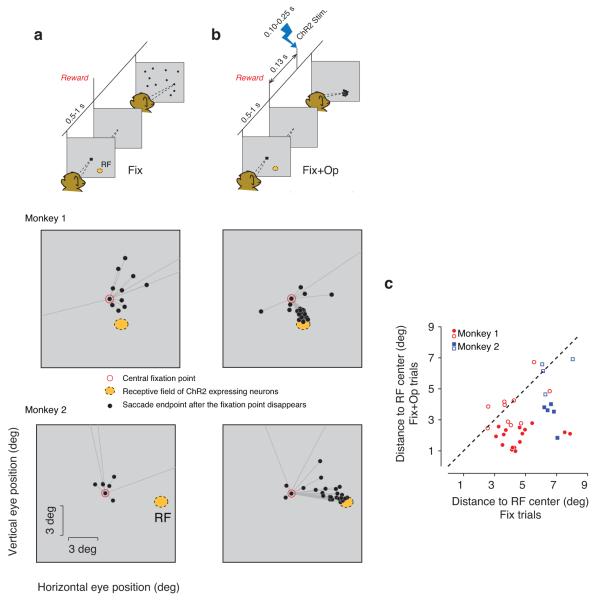
Task description and distributions of saccade endpoints in Fix trials. Schematics in (a) and (b) show task events for trials with and without optical stimulation (‘Fix’ and ‘Fix+Op’ respectively). On both Fix and Fix+Op trials, monkeys were required to maintain fixation for 0.5–1 sec on a central fixation point (FP, black square) and received liquid reward immediately after FP disappeared. On Fix+Op trials (b), the disappearance of FP was followed by optical stimulation, which consisted of light pulses of 0.1 to 0.25 sec duration. Black circles in the topmost panel of the schematic diagrams represent endpoints of spontaneous saccades made after the disappearance of FP. Middle and bottom panels show post–fixation spontaneous saccades in example experimental sessions in the two monkeys. Whereas in the Fix condition (a), saccade endpoints (black circles) were broadly distributed, in the Fix+Op condition, they were concentrated near the RF of the stimulated neurons (orange) even though no visual target was presented. In these sessions, the laser intensity was set to 50 mW for monkey 1 and 20 mW for monkey 2. (c) Comparison of saccade endpoints in trials with and without optical stimulation. For each experiment, we measured the distance of each saccade endpoint to the center of the RF of the optically stimulated neurons and computed a mean distance for the Fix and Fix+Op trials in each block. In most experiments, saccades in Fix+Op trials (ordinate) landed closer to the RF center than saccades n the Fix trials (abscissa). Red circles and blue squares correspond to data collected from monkey 1 and monkey 2, respectively. Filled symbols correspond to blocks in which the optical stimulation had a significant effect on behavior (Mann–Whitney, p<0.05).

V1 activity associated with the four experimental conditions. Each row corresponds to multiunit activity recorded at a different V1 site. In each panel, the raster plot shows spiking times (black ticks) of individual trials (rows), and the PSTH shows the average firing rates (bin width = 20 ms). (a) Spikes times and the corresponding PSTHs for the Fix conditions were aligned to the time when the fixation point disappeared. (b) In the Tar condition, spikes were aligned to the time of the onset of the visual target. In the Fix+Op (c) and Tar+Op (d) conditions, trials were aligned to the onset of optical stimulation (laser power: 50 mW). The top and bottom rows show PSTHs at recording sites approximately 450 and 525 μm from the cortical surface respectively. At both sites, Tar+Op responses (d) were more similar to Fix+Op responses (b) than to Tar responses (c). The blue bar indicates the duration of optical stimulation.
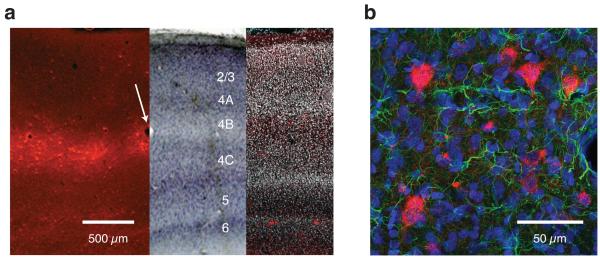
Histological analysis of ChR2 expression in V1. (a) Montage of three coronal sections of V1 near the injection site. The left section was unstained and was imaged for red fluorescence (ChR2–mCherry), the middle section was stained with cresyl violet and imaged under bright field, and the right section was stained with DAPI and imaged for red and blue fluorescence (DAPI has been rendered white). The unstained and cresyl violet–stained sections, which were 50 μm apart, were aligned digitally on the basis of blood vessels (e.g. white arrow). The DAPI–stained section, which was approximately 1 mm from the injection site, had fewer transduced cells (scattered red spots). (b) Fluorescence image of a coronal section of V1 near the site of injection showing ChR2–expressing cells (red) along with DAPI (blue) and GFAP staining (green). Because GFAP is expressed in glial cells, the absence of GFAP staining in ChR2–expressing cells suggests that the transduced cells were not glial.
References
-
- Aravanis AM, et al. An optical neural interface: in vivo control of rodent motor cortex with integrated fiberoptic and optogenetic technology. Journal of neural engineering. 2007;4:S143–156. - PubMed
Publication types
MeSH terms
Substances
Grants and funding
LinkOut - more resources
Full Text Sources
Other Literature Sources
