. 2012 Oct;44(10):1111-6.
doi: 10.1038/ng.2405. Epub 2012 Sep 2.

Comprehensive genomic analysis identifies SOX2 as a frequently amplified gene in small-cell lung cancer

Affiliations

Comprehensive genomic analysis identifies SOX2 as a frequently amplified gene in small-cell lung cancer

Charles M Rudin et al. Nat Genet. 2012 Oct.

Abstract

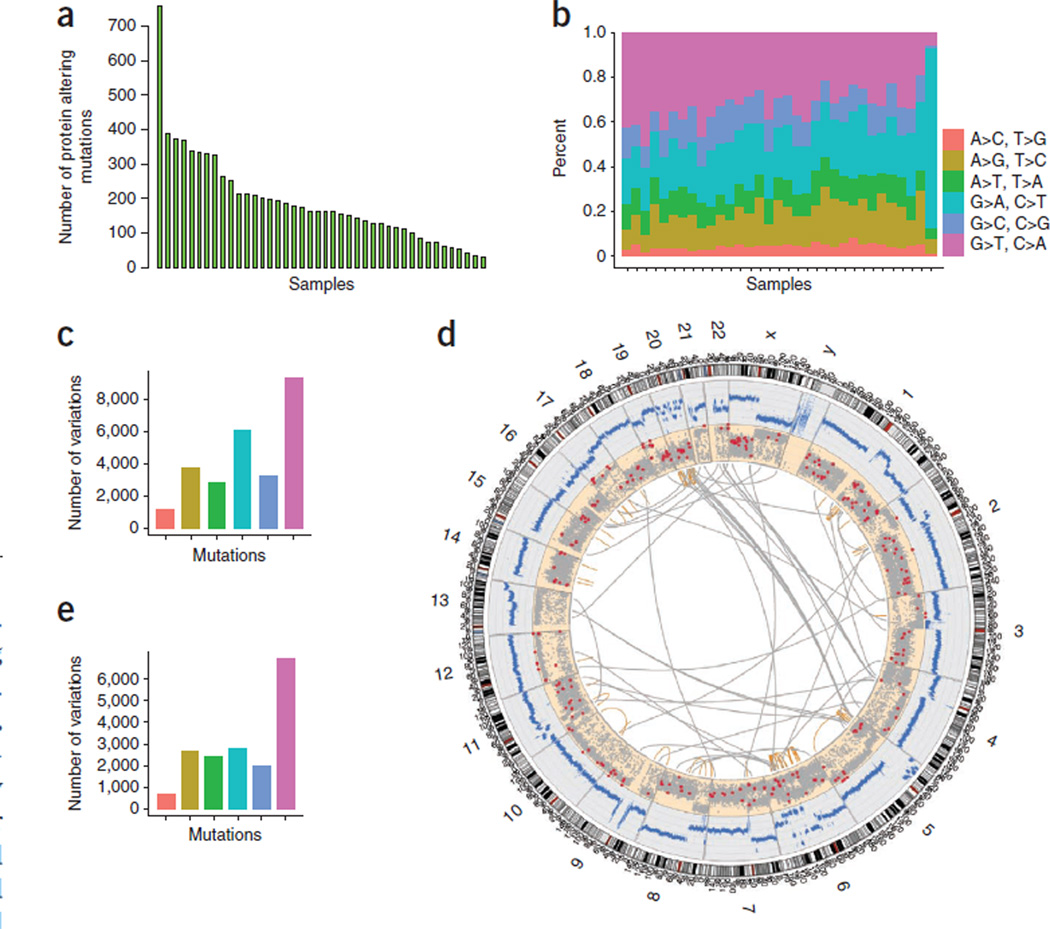
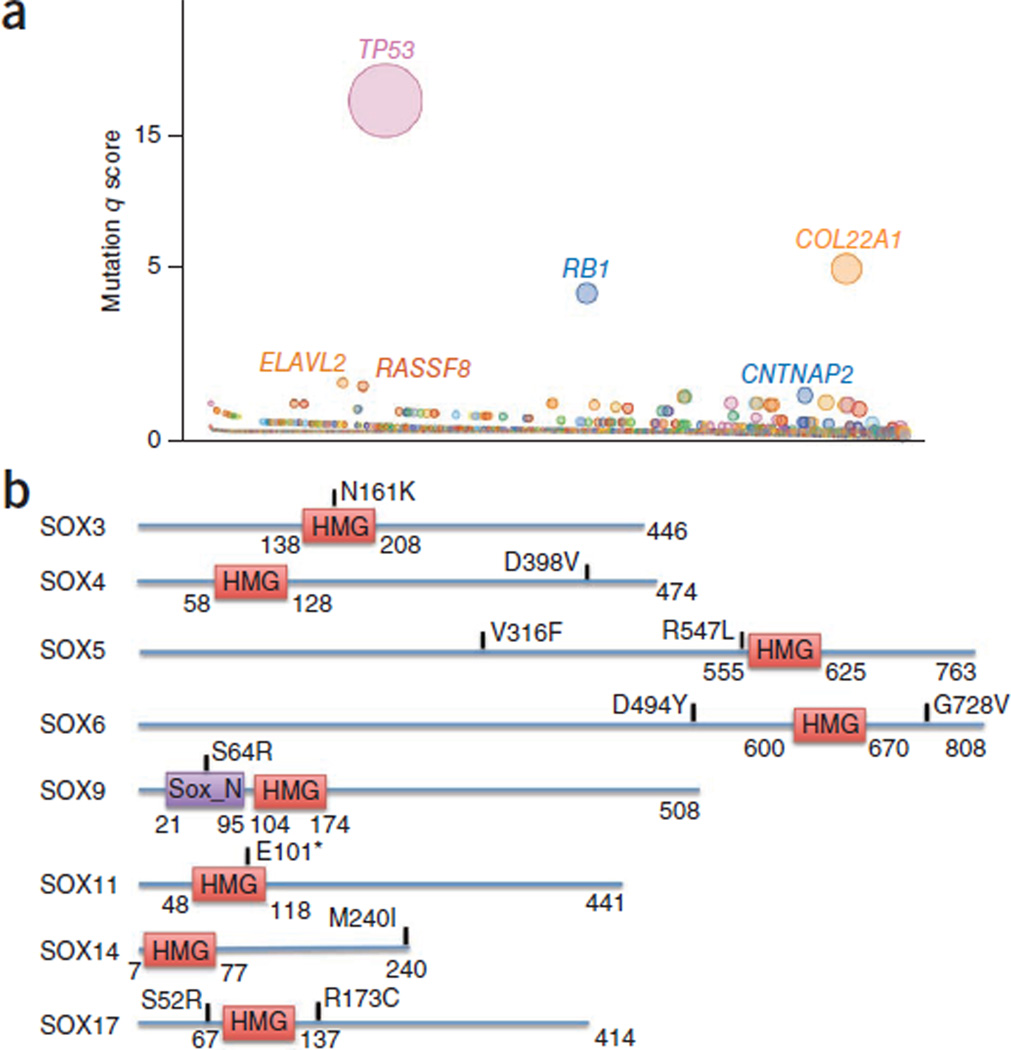
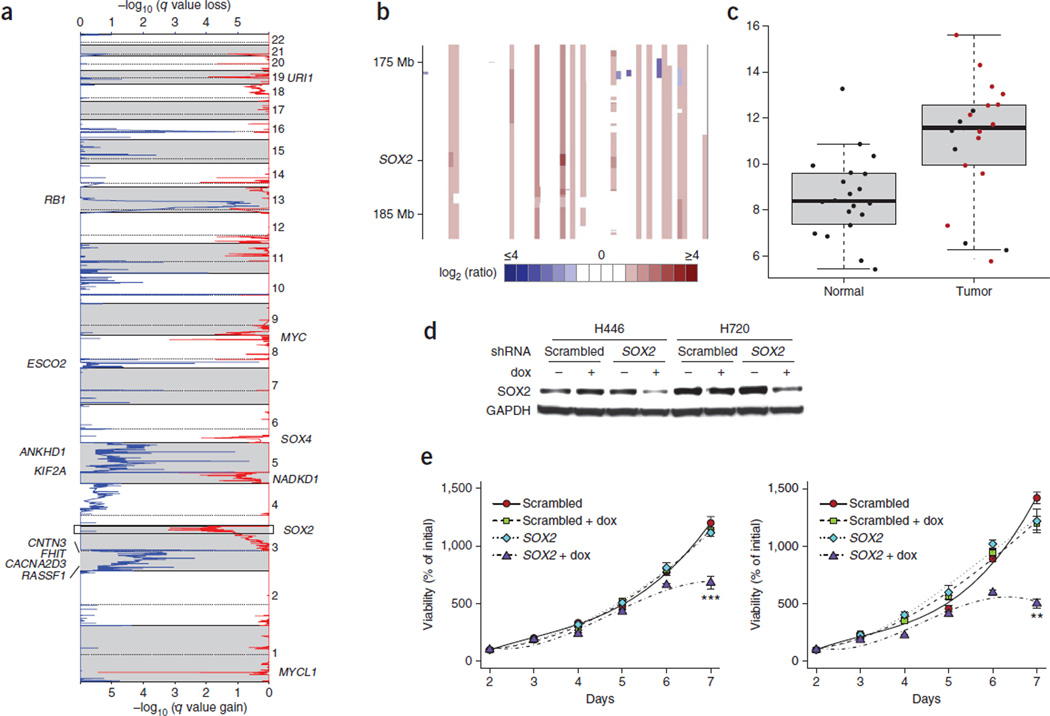
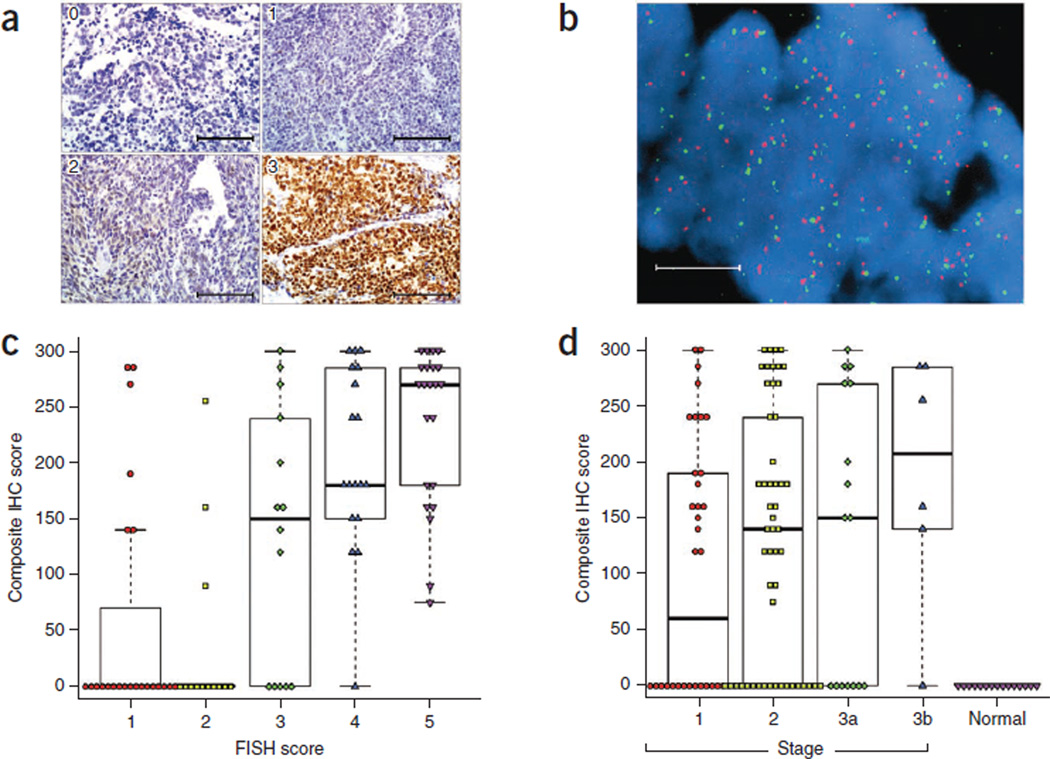
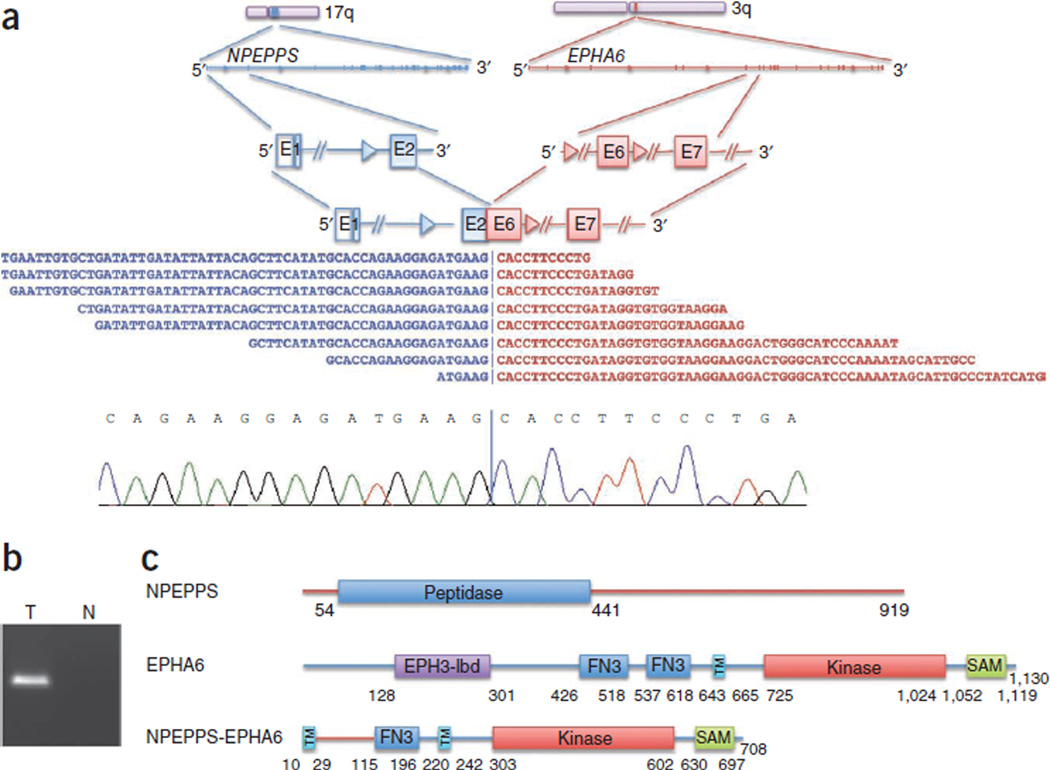
Small-cell lung cancer (SCLC) is an exceptionally aggressive disease with poor prognosis. Here, we obtained exome, transcriptome and copy-number alteration data from approximately 53 samples consisting of 36 primary human SCLC and normal tissue pairs and 17 matched SCLC and lymphoblastoid cell lines. We also obtained data for 4 primary tumors and 23 SCLC cell lines. We identified 22 significantly mutated genes in SCLC, including genes encoding kinases, G protein-coupled receptors and chromatin-modifying proteins. We found that several members of the SOX family of genes were mutated in SCLC. We also found SOX2 amplification in ∼27% of the samples. Suppression of SOX2 using shRNAs blocked proliferation of SOX2-amplified SCLC lines. RNA sequencing identified multiple fusion transcripts and a recurrent RLF-MYCL1 fusion. Silencing of MYCL1 in SCLC cell lines that had the RLF-MYCL1 fusion decreased cell proliferation. These data provide an in-depth view of the spectrum of genomic alterations in SCLC and identify several potential targets for therapeutic intervention.


Figures

Figure 1
Figure 1. SCLC somatic mutations
(a) Histogram of the number of mutations in each primary tumor sample. (b) Base-level transitions and transversions in each SCLC sample shown in a. (c) Average number of transitions and transversions in the SCLC samples based on the exome sequencing data. (d) Whole genome of an SCLC sample shown as a Circos plot. Copy-number changes measured using sequencing reads are shown in blue. Somatic nonsynonymous, splice-site and stop-gain mutations are shown as red dots. Other somatic mutations are depicted as gray dots. Intra- (orange lines) and interchromosomal (gray lines) rearrangements are also shown. (e) Average number of transitions and transversions in the whole-genome sequence of an SCLC sample. Colors in c and e correspond to those defined in b.
Figure 2
Figure 2. Significantly mutated genes in SCLC
(a) Genes evaluated for significance on the basis of q score are shown. Each gene is represented as a circle, where the size of the circle is proportional to the observed frequency of mutation in that gene. Genes are arranged on the x axis in order of increasing number of expected mutations from left to right. Genes with significant q scores are labeled. (b) Alterations affecting the SOX family. *, nonsense change; HMG, high-mobility group; Sox_N, Sox developmental protein N terminal.
Figure 3
Figure 3. SOX2 is amplified in SCLC and drives proliferation
(a) GISTIC plot depicting recurrent amplifications in SCLC samples (n = 56) with copy-number data. (b) Heatmap of segmented copy-number log2 (ratio) values from the 3q chromosomal region containing the SOX2 locus. (c) Box plot of SOX2 expression in SCLC and adjacent normal samples measured by RNA-seq. Samples with SOX2 amplification are highlighted in red. Error bars at the top indicate the maximum values excluding outliers, and error bars at the bottom indicate the minimum values excluding outliers. Outliers are defined as values more than the third quartile +1.5 × IQR or less than the first quartile −1.5 × IQR, where IQR is the innerquartile range. (d,e) Doxycycline-inducible shRNA targeting of SOX2 suppresses SOX2 protein levels (d) and inhibits cell proliferation (e) in H460 and H720 SCLC lines compared to scrambled control shRNA. Error bars in e, s.e.m. **P < 0.01; ***P < 0.001.
Figure 4
Figure 4. SOX2 gene amplification and protein expression in SCLC
SOX2 protein expression was assessed by IHC, and SOX2 gene copy number was assessed by FISH on a set of 110 SCLC cases and 15 normal lung controls. (a) Representative images showing variability of staining intensity by IHC, from 0 to 3. Scale bars, 100 µm. (b) Representative image showing very high SOX2 copy number by FISH. Red, SOX2 probe; green, centromeric probe. Scale bar, 10 µm. (c) Correlation between SOX2 IHC score (staining intensity × percent with positively stained nuclei) and SOX2 FISH score (1–6). (d) Composite SOX2 IHC score of SCLC samples by stage and normal lung controls. Plots in c and d are box plots where the box encloses the first to third quartiles, the bar inside the box represents the median, the whisker at the top indicates the maximum value excluding outliers and the whisker at the bottom indicates the minimum value excluding outliers. Outliers are defined as values more than the third quartile +1.5 × IQR or less than the first quartile −1.5 × IQR, where IQR is the interquartile range.
Figure 5
Figure 5. Kinase fusions
(a) NPEPPS-EPHA6 fusion identified using RNA-seq (top) along with a representative Sanger sequencing chromatogram derived from this fusion product (bottom). E, exon. (b) Independent product derived by RT-PCR confirming the NPEPPS-EPHA6 somatic fusion resolved on an agarose gel. RT-PCR was performed on a tumor (T) and normal (N) sample. (c) Schematic of the NPEPPS-EPHA6 fusion protein. EPH3-lbd, Ephrin receptor ligand–binding domain; FN3, fibronectin type 3 domain; TM, transmembrane domain; SAM, sterile α motif.

Comment in

Similar articles

Cited by

References

    1. Siegel R, Ward E, Brawley O, Jemal A. Cancer statistics, 2011: the impact of eliminating socioeconomic and racial disparities on premature cancer deaths. CA Cancer J. Clin. 2011;61:212–236. - PubMed
    1. Siegel R, Naishadham D, Jemal A. Cancer statistics, 2012. CA Cancer J. Clin. 2012;62:10–29. - PubMed
    1. Hann CL, Rudin CM. Fast, hungry and unstable: finding the Achilles’ heel of small-cell lung cancer. Trends Mol. Med. 2007;13:150–157. - PMC - PubMed
    1. Wistuba II, Gazdar AF, Minna JD. Molecular genetics of small cell lung carcinoma. Semin. Oncol. 2001;28:3–13. - PubMed
    1. Mori N, et al. Variable mutations of the RB gene in small-cell lung carcinoma. Oncogene. 1990;5:1713–1717. - PubMed

Publication types

MeSH terms