. 2012 Nov 1;40(20):10532-42.
doi: 10.1093/nar/gks718. Epub 2012 Aug 31.

The structural basis of differential DNA sequence recognition by restriction-modification controller proteins

Affiliations

The structural basis of differential DNA sequence recognition by restriction-modification controller proteins

N J Ball et al. Nucleic Acids Res. .

Abstract

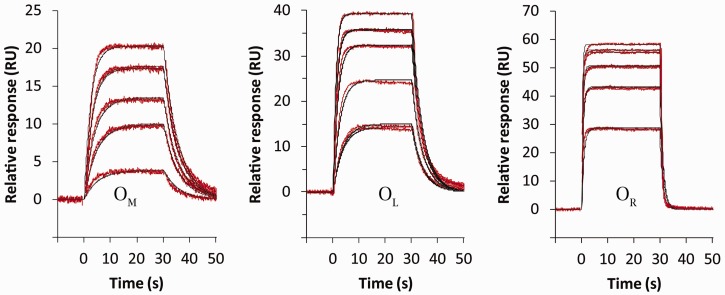
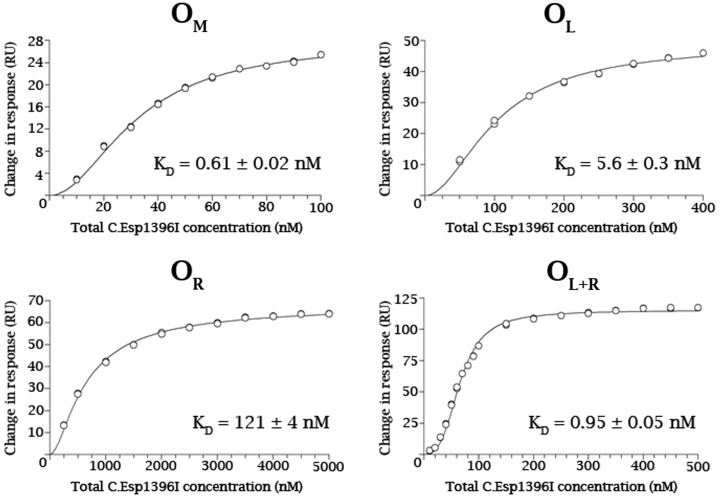
Controller (C) proteins regulate the expression of restriction-modification (RM) genes in a wide variety of RM systems. However, the RM system Esp1396I is of particular interest as the C protein regulates both the restriction endonuclease (R) gene and the methyltransferase (M) gene. The mechanism of this finely tuned genetic switch depends on differential binding affinities for the promoters controlling the R and M genes, which in turn depends on differential DNA sequence recognition and the ability to recognize dual symmetries. We report here the crystal structure of the C protein bound to the M promoter, and compare the binding affinities for each operator sequence by surface plasmon resonance. Comparison of the structure of the transcriptional repression complex at the M promoter with that of the transcriptional activation complex at the R promoter shows how subtle changes in protein-DNA interactions, underpinned by small conformational changes in the protein, can explain the molecular basis of differential regulation of gene expression.


Figures

Figure 1.
Figure 1.
Regulation of restriction (R) and modification (M) genes by C.Esp1396I. The upper figure shows convergent gene organization and the location of the three operator sites: OM, OL and OR. The sequences of these sites are shown below, with the specific recognition motifs shown in magenta and yellow, and the central TATA in cyan. The C implicated in a possible interaction with D34 is indicated in red. Adapted from Bogdanova et al. (15).
Figure 2.
Figure 2.
Structure of the two nucleoprotein complexes in the asymmetric unit of the C.Esp1396I/OM complex. Top: The sequence of the two DNA chains highlights the non-symmetric base pairs (AT and CG). Bottom: The two DNA duplexes in each complex are held together by an AT base pair formed from the 5’ overhanging bases.
Figure 3.
Figure 3.
Analysis of DNA structure in the two DNA–protein complexes in the asymmetric unit, showing the local bend angle and groove width at each base pair.
Figure 4.
Figure 4.
DNA–protein contacts. Top: Rotation and superposition of the two subunits of the complex show symmetrical interactions to the DNA (inset: interactions of amino acids R35, T36 and R46 with bases G3 on one strand and G13, T14 and C15 on the other; the water atom is omitted for clarity). Middle: Schematic representation of the hydrogen bonding contacts. Bottom: Overview of specific base contacts and contacts to the DNA phosphates (yellow and blue circles).
Figure 5.
Figure 5.
SPR kinetic analysis. For each operator site, the C protein was injected into the sample channel at five different protein concentrations (in duplicate), and the responses recorded after subtraction from the reference channel. Data were fitted to obtain the on- and off-rates for the interaction (see Table 1).
Figure 6.
Figure 6.
Equilibrium binding analysis. Equilibrium binding at saturation was plotted against total protein concentration (expressed as monomer) from the SPR data shown in Figure 5. For OM, OL and OR, the curves were fitted to a single-site binding model to obtain the relevant dissociation constants, KD. For OL + OR, a two site binding model was employed; the Kd for binding to OL was fixed at the value obtained experimentally for the isolated operator site, thus permitting the determination of the affinity for the second site (OR) when OL is already occupied.
Figure 7.
Figure 7.
Comparison of the structures of complexes of C.Esp1396I bound to the operators OL and OM (yellow and magenta, respectively) showing the displacement of the DNA bases. Although the sidechains of the alpha-helices in the two complexes are superimposed (a) the loop regions (b) are in quite different conformations, resulting in large displacements of amino acid side chains of N44 and S45, together with a smaller movement of R46.

References

    1. Jeltsch A. Maintenance of species identity and controlling speciation of bacteria: a new function for restriction/ modification systems? Gene. 2003;317:13–16. - PubMed
    1. Wilson GG, Murray NE. Restriction and modification systems. Ann. Rev. Genet. 1991;25:585–627. - PubMed
    1. Tao T, Bourne JC, Blumenthal RM. A family of regulatory genes associated with type II restriction-modification systems. J. Bacteriol. 1991;173:1367–1375. - PMC - PubMed
    1. Ives CL, Nathan PD, Brooks JE. Regulation of the BamHI restriction-modification system by a small intergenic open reading frame, bamHIC, in both Escherichia coli and Bacillus subtilis. J. Bacteriol. 1992;174:7194–7201. - PMC - PubMed
    1. Rimseliene R, Vaisvila R, Janulaitis A. The eco72IC gene specifies a trans-acting factor which influences expression of both DNA methyltransferase and endonuclease from the Eco72I restriction-modification system. Gene. 1995;157:217–219. - PubMed

Publication types

MeSH terms