. 2012 Nov 1;40(20):10124-38.
doi: 10.1093/nar/gks770. Epub 2012 Aug 31.

Mitochondrial DNA copy number is regulated in a tissue specific manner by DNA methylation of the nuclear-encoded DNA polymerase gamma A

Affiliations

Mitochondrial DNA copy number is regulated in a tissue specific manner by DNA methylation of the nuclear-encoded DNA polymerase gamma A

Richard D W Kelly et al. Nucleic Acids Res. .

Abstract

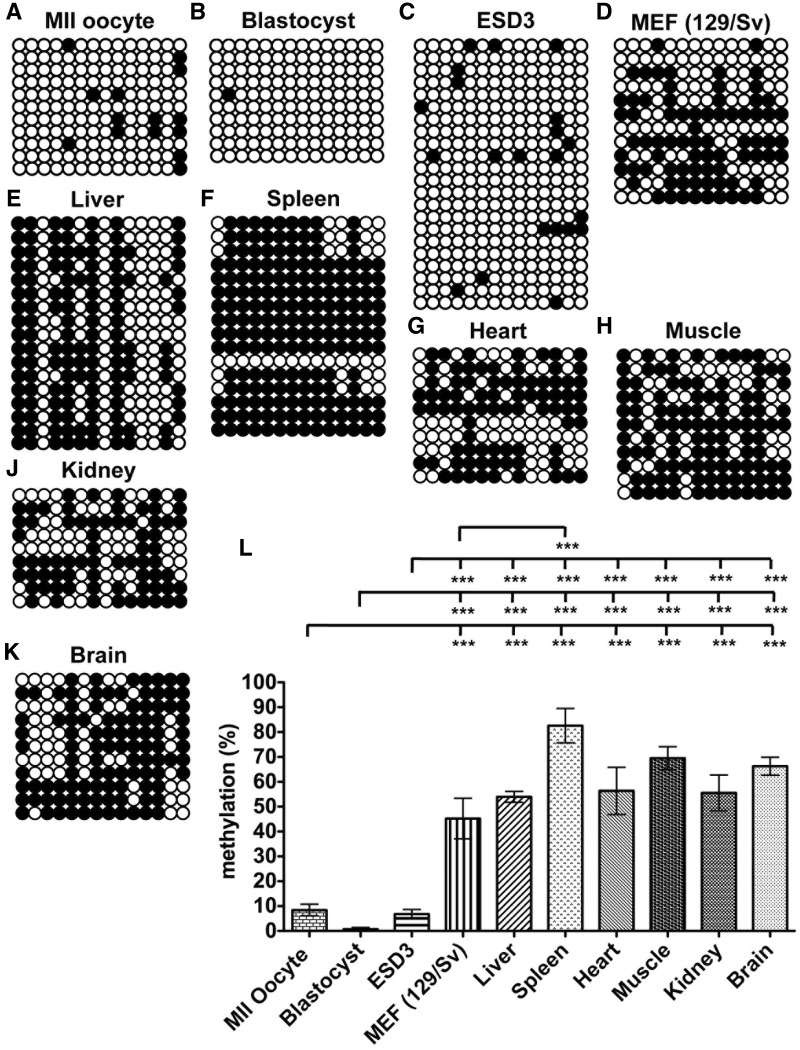
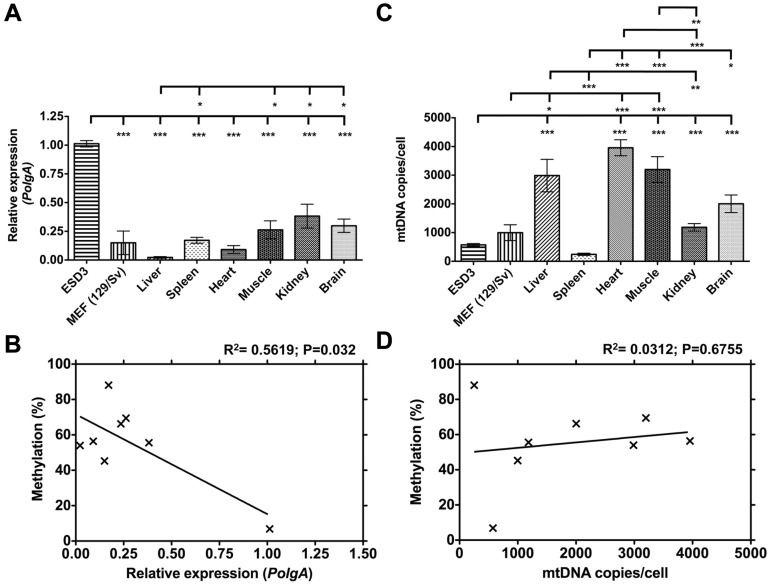
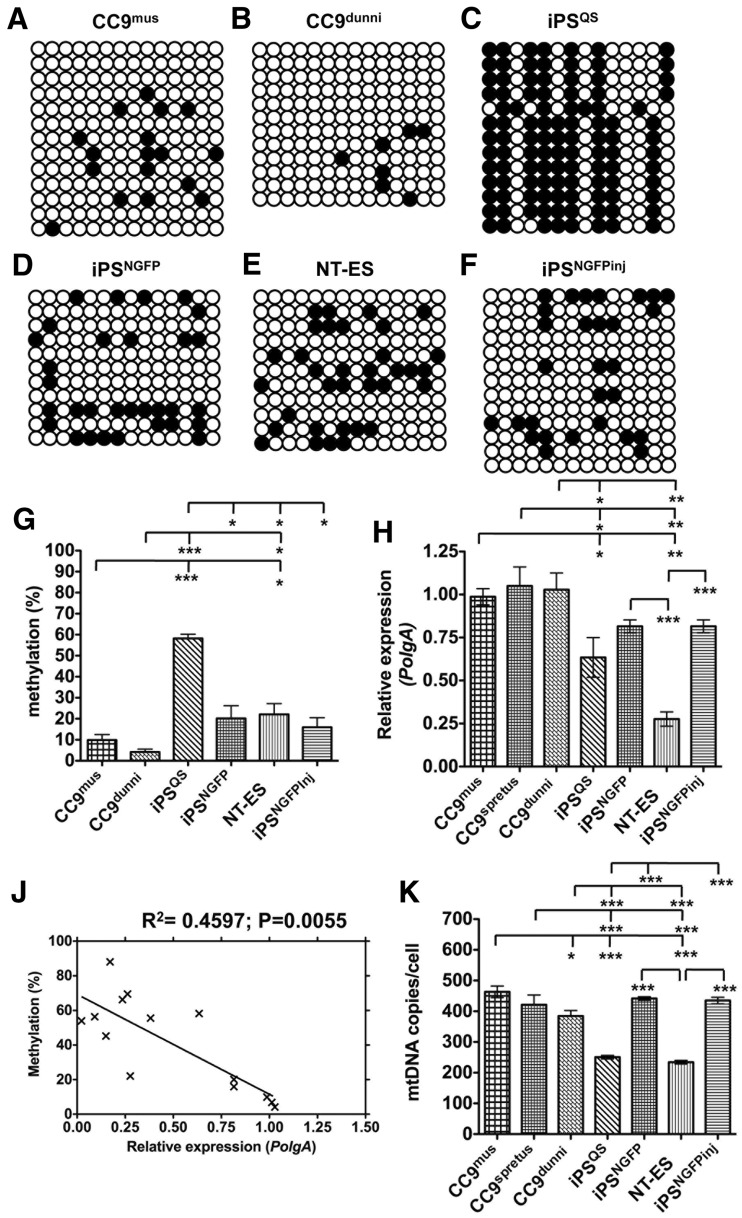
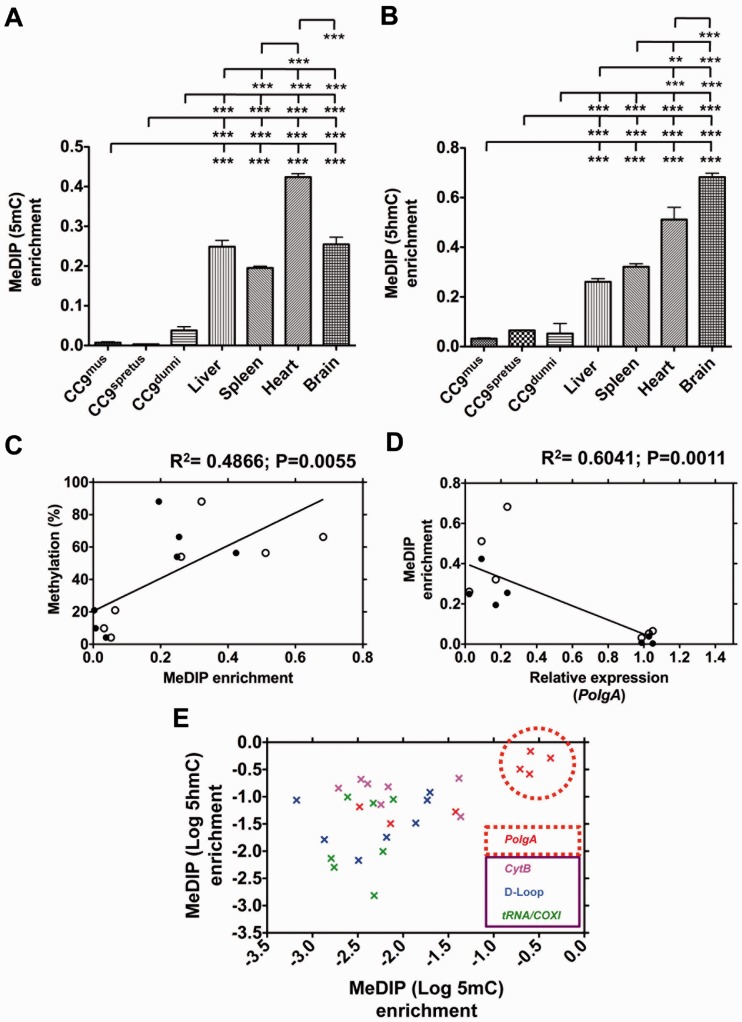
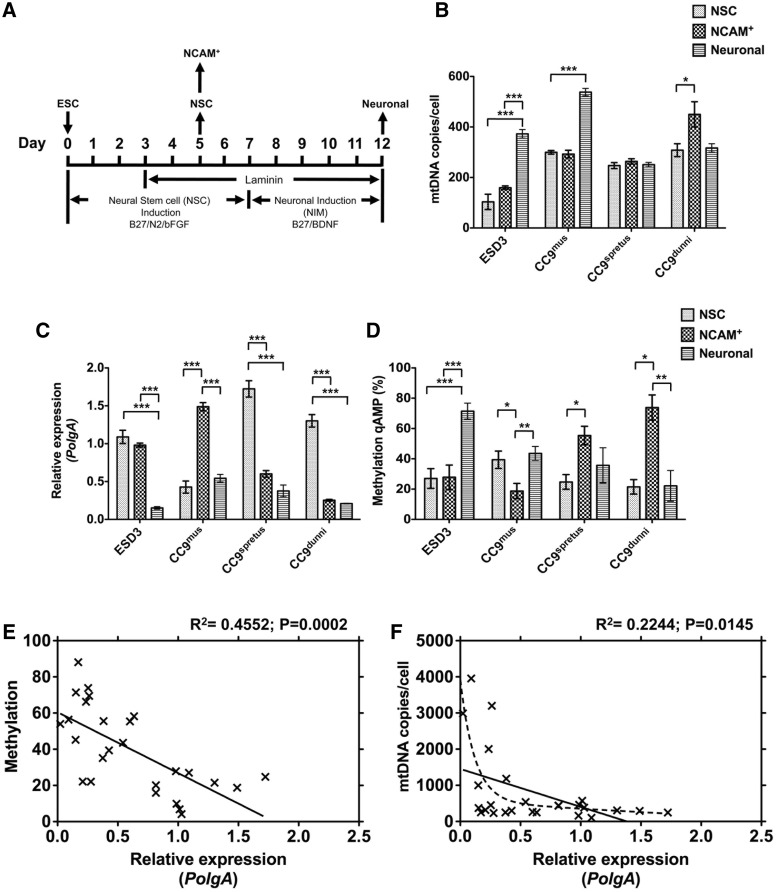
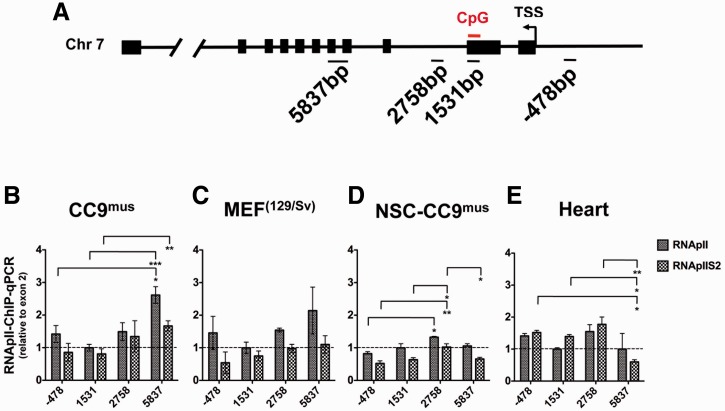
DNA methylation is an essential mechanism controlling gene expression during differentiation and development. We investigated the epigenetic regulation of the nuclear-encoded, mitochondrial DNA (mtDNA) polymerase γ catalytic subunit (PolgA) by examining the methylation status of a CpG island within exon 2 of PolgA. Bisulphite sequencing identified low methylation levels (<10%) within exon 2 of mouse oocytes, blastocysts and embryonic stem cells (ESCs), while somatic tissues contained significantly higher levels (>40%). In contrast, induced pluripotent stem (iPS) cells and somatic nuclear transfer ESCs were hypermethylated (>20%), indicating abnormal epigenetic reprogramming. Real time PCR analysis of 5-methylcytosine (5mC) and 5-hydroxymethylcytosine (5hmC) immunoprecipitated DNA suggests active DNA methylation and demethylation within exon 2 of PolgA. Moreover, neural differentiation of ESCs promoted de novo methylation and demethylation at the exon 2 locus. Regression analysis demonstrates that cell-specific PolgA expression levels were negatively correlated with DNA methylation within exon 2 and mtDNA copy number. Finally, using chromatin immunoprecipitation (ChIP) against RNA polymerase II (RNApII) phosphorylated on serine 2, we show increased DNA methylation levels are associated with reduced RNApII transcriptional elongation. This is the first study linking nuclear DNA epigenetic regulation with mtDNA regulation during differentiation and cell specialization.


Figures

Figure 1.
Figure 1.
DNA methylation analysis of PolgA exon 2 in gametes, embryos, pluripotent and somatic cells. Bisulphite sequencing of the 14 CpG methylation sites in (A) MII oocytes, (B) blastocysts, (C) ESD3 cells, (D) MEF (129/Sv), (E) Liver, (F) Spleen, (G) Heart, (H) Muscle, (J) Kidney and (K) Brain samples. Open and filled circles represent unmethylated and methylated CpGs, respectively. (L) The percentage CpG methylation per sequence determined by bisulphite sequencing (% mean ± SEM). Significant differences between cell types are: ***P < 0.001.
Figure 2.
Figure 2.
DNA Methylation of exon 2 correlates with reduced steady state mRNA levels of PolgA. (A) Real time PCR quantification of PolgA expression in cultured ESD3 and MEF cells, and in liver, spleen, heart, muscle, kidney and brain samples, expressed relative to ESD3. (B) The relationship between DNA methylation levels from Figure 1L and the corresponding PolgA expression was determined using Pearson correlation coefficient (R2). (C) MtDNA copies/cell in cultured ESD3 and MEF cells, and liver, spleen, heart, muscle, kidney and brain, as determined by real time PCR. (D) The relationship between the levels of DNA methylation from Figure 1L and the corresponding mtDNA copies/cell was determined using Pearson correlation coefficient (R2). Values represent mean ± SEM and significant differences between cell types are: *P < 0.05; **P < 0.01 and ***P < 0.001.
Figure 3.
Figure 3.
Intragenic methylation of PolgA in reprogrammed and mtDNA divergent ESCs. Bisulphite sequencing analysis of CpG methylation in (A) CC9mus, (B) CC9dunni, (C) iPSQS, (D) iPSNGFP2 (E) NT-ES, (F) iPSNFGPinj pluripotent stem cells. (G) The percentage CpG methylation per sequence determined by bisulphite sequencing (percentage mean ± SEM). (H) Real time PCR quantification of PolgA expression in cultured CC9mus, CC9spretus, CC9dunni, iPSQS/R26 (iPSQS), iPSNGFP, NT-ES, iPSNGFPinj pluripotent stem cells expressed relative to ESD3 cells. (J) Cumulative analysis of the relationship between DNA methylation levels (Figures 1L and 3G) and the expression of PolgA (Figures 2A and 3H) performed using Pearson correlation coefficient (R2). (K) MtDNA copies/cell in cultured CC9mus, CC9spretus, CC9dunni, iPSQS/R26, iPSNGFP, NT-ES, iPSNGFPinj pluripotent stem cells. Values represent mean ± SEM and significant differences between cell types are: *P < 0.05; **P < 0.01 and ***P < 0.001.
Figure 4.
Figure 4.
Analysis of PolgA and mtDNA enrichment in 5mC and 5hmC MeDIP of ESCs and somatic tissues. DNA samples from cultured CC9mus, CC9spretus and CC9dunni cells; liver, spleen, heart and brain samples were immunoprecipitated using antibodies against (A) 5mC and (B) 5hmC, and analysed using real time PCR for PolgA (exon 2) enrichment. Bars represent means ± SEM. Significant differences between cell types are indicated (**P < 0.01; ***P < 0.001). (C) MeDIP (5mC and 5hmC) enrichment (Figure 4A and B) was validated against the corresponding means for bisulphite sequencing methylation levels (Figures 1L and 3G) using Pearson correlation coefficient (R2). Closed circles represent 5mC enrichment and open circles represent 5hmC enrichment. The P-value signifies the significance of the line from zero. (D) The relationship between PolgA expression and the corresponding MeDIP (5mC and 5hmC) enrichment levels using a Pearson correlation coefficient (R2). Closed circles represent 5mC enrichment and open circles represent 5hmC enrichment. The P-value signifies the significance of the line from zero. (E) Real time PCR for the enrichment of PolgA (exon 2) and mtDNA (CytB, tRNA/COXI and D-loop regions) in 5mC and 5hmC immunoprecipitated DNA. Enrichment values for CC9mus, CC9spretus and CC9dunni cells; and liver, spleen, heart and brain samples were normalized against β-actin (unmethylated control). Data shown is log10 5mC against log10 5hmC. Data points are colour-coded to represent DNA sequences analysed (PolgA exon 2 and mtDNA: CytB, tRNA/COXi and D-loop regions). Data points highlighted in the red circle represent the high levels of enrichment observed for liver, spleen, heart and brain samples (cf Figure 4A and B).
Figure 5.
Figure 5.
Intragenic PolgA methylation during neural differentiation. (A) Time chart representing the induction of neural differentiation in ESD3, CC9mus, CC9spretus and CC9dunni ESCs. The abbreviations beneath the timeline show the components of media and culture conditions that were used to induce neural (NSC) and neuronal differentiation. ESCs were differentiated as a monolayer culture for 5 days in neural stem cell media containing the supplements B27 and N2 for neural induction, and further supplemented with basic fibroblast growth factor (bFGF). At this time point, we also isolated NCAM+ cells, in order to enrich for neural precursor cells, or allowed the cells to continue to differentiate for a further 7 days, in neuronal induction media containing B27 supplement and brain-derived neurotrophic factor (BDNF). MtDNA copy number (B), PolgA expression (C) and DNA methylation (D) were assessed: on Day 5 of differentiation (NSC); in NCAM+ cells on Day 5 of differentiation and; on Day 12 of neuronal differentiation. (E) Cumulative analysis of the relationship between DNA methylation (cf Figures 1L, 3G, 5D) and the expression of PolgA (cf Figures 2A, 3H, 5C) was determined using Pearson correlation coefficient (R2). (F) Cumulative analysis of the relationship between mtDNA copy number (cf Figures 2C, 3K, 5B) and the expression of PolgA (cf Figures 2A, 3H, 5C) was determined using Pearson correlation coefficient (R2: straight line = linear regression; dashed line = non-linear regression analysis).
Figure 6.
Figure 6.
DNA methylation at the Exon 2 loci is associated with reduced RNApII transcriptional elongation. (A) Diagrammatic representation of the PolgA gene and primers sites used for ChIP. Numbers correspond to the centre nucleotide of each primer amplicon, relative to the transcription start site (TSS). Enrichment for (RNApII) and RNApII phosphorylated on serine 2 of the carboxy-terminal domain (RNApIIS2) was analysed by real time PCR at the exon 2 methylation site of PolgA and at downstream and upstream regions in: (B) CC9mus; (C) MEF; (D) NSC-CC9mus and (E) heart samples. Values represent mean ± SEM. Significant differences between cell types are: *P < 0.05; **P < 0.01 and ***P < 0.001.

References

    1. Anderson S, Bankier AT, Barrell BG, de Bruijn MH, Coulson AR, Drouin J, Eperon IC, Nierlich DP, Roe BA, Sanger F, et al. Sequence and organization of the human mitochondrial genome. Nature. 1981;290:457–465. - PubMed
    1. Clayton DA. Replication of animal mitochondrial DNA. Cell. 1982;28:693–705. - PubMed
    1. Tuppen HA, Blakely EL, Turnbull DM, Taylor RW. Mitochondrial DNA mutations and human disease. Biochim. Biophys. Acta. 2010;1797:113–128. - PubMed
    1. Ropp PA, Copeland WC. Cloning and characterization of the human mitochondrial DNA polymerase, DNA polymerase gamma. Genomics. 1996;36:449–458. - PubMed
    1. Sweasy JB, Lauper JM, Eckert KA. DNA polymerases and human diseases. Radiat. Res. 2006;166:693–714. - PubMed

Publication types

MeSH terms