

MutSβ and histone deacetylase complexes promote expansions of trinucleotide repeats in human cells
- PMID: 22941650
- PMCID: PMC3488247
- DOI: 10.1093/nar/gks810
MutSβ and histone deacetylase complexes promote expansions of trinucleotide repeats in human cells
Abstract
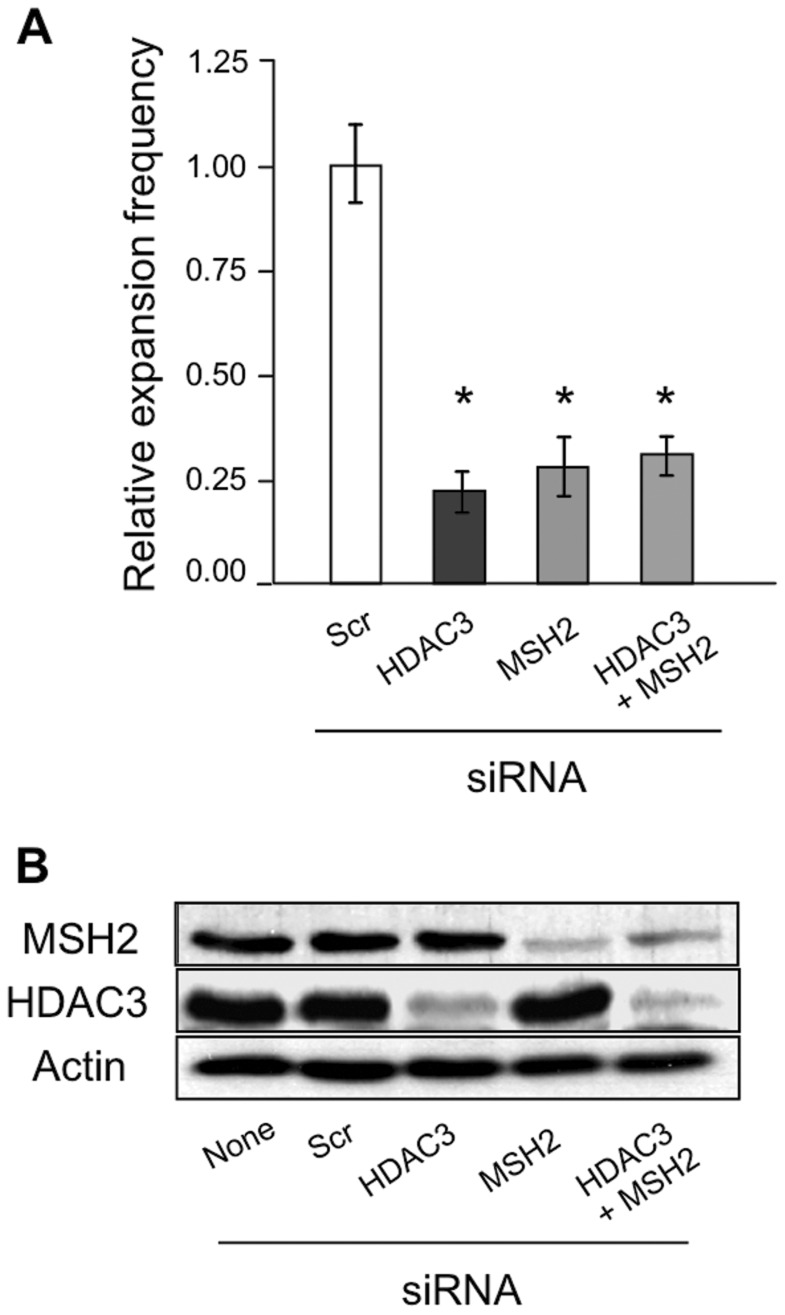
Trinucleotide repeat (TNR) expansions cause at least 17 heritable neurological diseases, including Huntington's disease. Expansions are thought to arise from abnormal processing of TNR DNA by specific trans-acting proteins. For example, the DNA repair complex MutSβ (MSH2-MSH3 heterodimer) is required in mice for on-going expansions of long, disease-causing alleles. A distinctive feature of TNR expansions is a threshold effect, a narrow range of repeat units (∼30-40 in humans) at which mutation frequency rises dramatically and disease can initiate. The goal of this study was to identify factors that promote expansion of threshold-length CTG•CAG repeats in a human astrocytic cell line. siRNA knockdown of the MutSβ subunits MSH2 or MSH3 impeded expansions of threshold-length repeats, while knockdown of the MutSα subunit MSH6 had no effect. Chromatin immunoprecipitation experiments indicated that MutSβ, but not MutSα, was enriched at the TNR. These findings imply a direct role for MutSβ in promoting expansion of threshold-length CTG•CAG tracts. We identified the class II deacetylase HDAC5 as a novel promoting factor for expansions, joining the class I deacetylase HDAC3 that was previously identified. Double knockdowns were consistent with the possibility that MutSβ, HDAC3 and HDAC5 act through a common pathway to promote expansions of threshold-length TNRs.
Figures


Similar articles
-
Large expansion of CTG•CAG repeats is exacerbated by MutSβ in human cells.Sci Rep. 2015 Jun 5;5:11020. doi: 10.1038/srep11020. Sci Rep. 2015. PMID: 26047474 Free PMC article.
-
MutSβ abundance and Msh3 ATP hydrolysis activity are important drivers of CTG•CAG repeat expansions.Nucleic Acids Res. 2017 Sep 29;45(17):10068-10078. doi: 10.1093/nar/gkx650. Nucleic Acids Res. 2017. PMID: 28973443 Free PMC article.
-
HDAC3 deacetylates the DNA mismatch repair factor MutSβ to stimulate triplet repeat expansions.Proc Natl Acad Sci U S A. 2020 Sep 22;117(38):23597-23605. doi: 10.1073/pnas.2013223117. Epub 2020 Sep 8. Proc Natl Acad Sci U S A. 2020. PMID: 32900932 Free PMC article.
-
Disease-associated repeat instability and mismatch repair.DNA Repair (Amst). 2016 Feb;38:117-126. doi: 10.1016/j.dnarep.2015.11.008. Epub 2015 Dec 12. DNA Repair (Amst). 2016. PMID: 26774442 Review.
-
Coordinated roles of SLX4 and MutSβ in DNA repair and the maintenance of genome stability.Crit Rev Biochem Mol Biol. 2021 Apr;56(2):157-177. doi: 10.1080/10409238.2021.1881433. Epub 2021 Feb 17. Crit Rev Biochem Mol Biol. 2021. PMID: 33596761 Free PMC article. Review.
Cited by
-
The 26S proteasome drives trinucleotide repeat expansions.Nucleic Acids Res. 2013 Jul;41(12):6098-108. doi: 10.1093/nar/gkt295. Epub 2013 Apr 24. Nucleic Acids Res. 2013. PMID: 23620289 Free PMC article.
-
Histone deacetylase knockouts modify transcription, CAG instability and nuclear pathology in Huntington disease mice.Elife. 2020 Sep 29;9:e55911. doi: 10.7554/eLife.55911. Elife. 2020. PMID: 32990597 Free PMC article.
-
DNA Mismatch Repair and its Role in Huntington's Disease.J Huntingtons Dis. 2021;10(1):75-94. doi: 10.3233/JHD-200438. J Huntingtons Dis. 2021. PMID: 33579865 Free PMC article. Review.
-
Massive contractions of myotonic dystrophy type 2-associated CCTG tetranucleotide repeats occur via double-strand break repair with distinct requirements for DNA helicases.G3 (Bethesda). 2024 Feb 7;14(2):jkad257. doi: 10.1093/g3journal/jkad257. G3 (Bethesda). 2024. PMID: 37950892 Free PMC article.
-
Heterozygosity for a hypomorphic Polβ mutation reduces the expansion frequency in a mouse model of the Fragile X-related disorders.PLoS Genet. 2015 Apr 17;11(4):e1005181. doi: 10.1371/journal.pgen.1005181. eCollection 2015 Apr. PLoS Genet. 2015. PMID: 25886163 Free PMC article.
References
-
- Orr HT, Zoghbi HY. Trinucleotide repeat disorders. Annu. Rev. Neurosci. 2007;30:575–621. - PubMed
-
- Mirkin SM. Expandable DNA repeats and human disease. Nature. 2007;447:932–940. - PubMed
-
- Kovtun IV, McMurray CT. Features of trinucleotide repeat instability in vivo. Cell Res. 2008;18:198–213. - PubMed
-
- Lopez Castel A, Cleary JD, Pearson CE. Repeat instability as the basis for human diseases and as a potential target for therapy. Nat. Rev. Mol. Cell. Biol. 2010;11:165–170. - PubMed
-
- Paulson HL, Fischbeck KH. Trinucleotide repeats in neurogenetic disorders. Annu. Rev. Neurosci. 1996;19:79–107. - PubMed
Publication types
MeSH terms
Substances
LinkOut - more resources
Full Text Sources
Other Literature Sources
Miscellaneous
