. 2012 Aug;24(8):3463-81.
doi: 10.1105/tpc.112.101758. Epub 2012 Aug 31.

Selective regulation of maize plasma membrane aquaporin trafficking and activity by the SNARE SYP121

Affiliations

Selective regulation of maize plasma membrane aquaporin trafficking and activity by the SNARE SYP121

Arnaud Besserer et al. Plant Cell. 2012 Aug.

Abstract

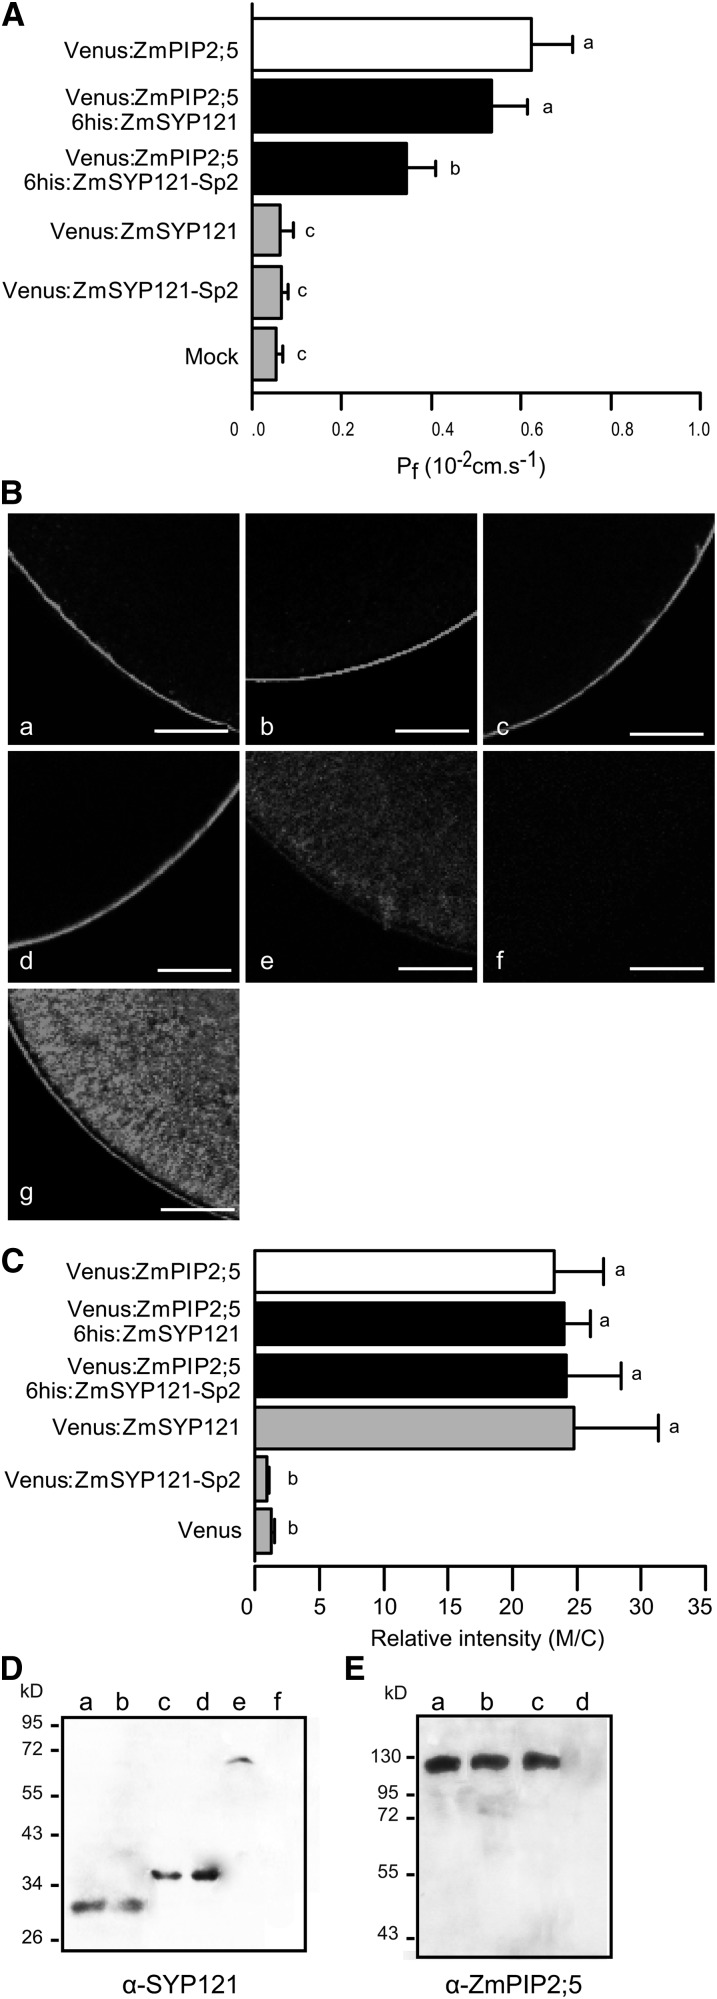
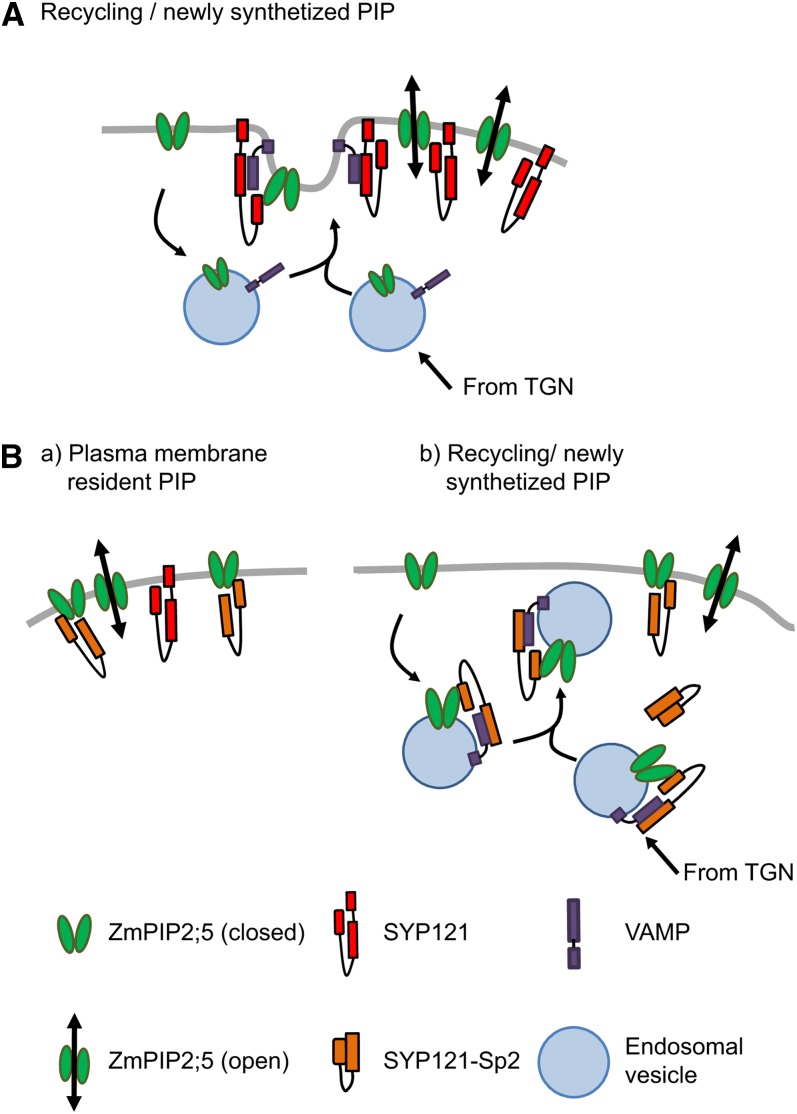
Plasma membrane intrinsic proteins (PIPs) are aquaporins facilitating the diffusion of water through the cell membrane. We previously showed that the traffic of the maize (Zea mays) PIP2;5 to the plasma membrane is dependent on the endoplasmic reticulum diacidic export motif. Here, we report that the post-Golgi traffic and water channel activity of PIP2;5 are regulated by the SNARE (for soluble N-ethylmaleimide-sensitive factor protein attachment protein receptor) SYP121, a plasma membrane resident syntaxin involved in vesicle traffic, signaling, and regulation of K(+) channels. We demonstrate that the expression of the dominant-negative SYP121-Sp2 fragment in maize mesophyll protoplasts or epidermal cells leads to a decrease in the delivery of PIP2;5 to the plasma membrane. Protoplast and oocyte swelling assays showed that PIP2;5 water channel activity is negatively affected by SYP121-Sp2. A combination of in vitro (copurification assays) and in vivo (bimolecular fluorescence complementation, Förster resonance energy transfer, and yeast split-ubiquitin) approaches allowed us to demonstrate that SYP121 and PIP2;5 physically interact. Together with previous data demonstrating the role of SYP121 in regulating K(+) channel trafficking and activity, these results suggest that SYP121 SNARE contributes to the regulation of the cell osmotic homeostasis.


Figures

Figure 1.
Figure 1.
Both AtSYP121-Sp2 and ZmSYP121-Sp2 Fragments Selectively Reduce the Accumulation of Zm-PIP2;5 in the Plasma Membrane of Maize Mesophyll Protoplasts. (A) Plasma membrane abundance of mYFP:ZmPIP2;5 in maize mesophyll protoplasts. (a) to (c) Protoplast expressing mYFP:ZmPIP2;5 (a). (b) Channel showing the FM4-64 fluorescence and chlorophyll a autofluorescence. (c) Merged image. (d) to (f) Protoplast coexpressing mYFP:PIP2;5 (d) and mCFP:PMA2 (e). (f) Merged image. (g) to (i) Protoplast coexpressing mYFP:PIP2;5 (g) and mCFP:AtSYP121-Sp2 (h). (i) Merged image. Bars = 5 µm. (B) Quantification of mYFP:ZmPIP2;5 fluorescence intensity in the protoplast plasma membrane (PM). Acquisitions were performed with the same settings for all samples. Each bar represents the mean of five independent experiments (10 protoplasts per experiment). Error bars show the 95% confidence interval. Student’s t test, P < 0.05 was used to compare the data. Means that are significantly different (P < 0.05) are indicated by different letters. a.u., arbitrary units. (C) Plasma membrane abundance of Zm-PIP2;5 in maize mesophyll protoplasts. (a) and (b) Protoplast expressing mYFP:ZmPIP2;5 (b). (a) Chlorophyll a autofluorescence. (c) and (d) Protoplast coexpressing the soluble mCFP (c) and mYFP:ZmPIP2;5 (d). (e) and (f) Protoplast coexpressing mCFP:ZmSYP121 (e) and mYFP:ZmPIP2;5 (f). (g) and (h) Protoplast coexpressing mCFP:ZmSYP121-Sp2 (g) and mYFP:ZmPIP2;5 (h). All the pictures were acquired with the same settings. In panel (a), the chloroplast autofluorescence is shown, whereas, in panels (c), (e), and (f), it is subtracted. Bars = 5µm. (D) Quantification of mYFP:ZmPIP2;5 fluorescence intensity in the protoplast plasma membrane. Each bar represents the mean of three independent experiments (10 protoplasts by experiments). Error bars show 95% confidence interval. Statistical differences were inferred by analysis of variance (ANOVA) followed by Tukey's honestly significant difference test. Means that are significantly different (P < 0.05) are indicated by different letters. (E) Plasma membrane abundance of mCFP:PMA2 in maize mesophyll protoplasts. (a) to (c) Protoplast expressing mCFP:PMA2 (a). (b) YFP channel. (c) Chlorophyll a channel. (d) to (f) Protoplast coexpressing mCFP:PMA2 (d) and mYFP:ZmSYP121-Sp2 (e). (f) Chlorophyll a channel. All the images were acquired with the same settings. Bars = 5 µm. (F) Quantification of mCFP:PMA2 fluorescence intensity in the protoplast plasma membrane. Each bar represents the mean of three independent experiments (10 protoplasts per experiment). Error bars show the 95% confidence interval. Means are not significantly different (Student’s t test, P = 0.90).
Figure 2.
Figure 2.
Inhibition of Zm-PIP2;5 Delivery to the Plasma Membrane Is Specific for ZmSYP121-Sp2. (A) Plasma membrane abundance of mYFP:ZmPIP2;5 in maize mesophyll protoplasts. (a) and (b) Protoplast expressing mYFP:ZmPIP2;5 (b). (a) Chlorophyll a autofluorescence. (c) and (d) Protoplast coexpressing mCFP:ZmSYP121 (c) and mYFP:ZmPIP2;5 (d). (e) and (f) Protoplast coexpressing mCFP:ZmSYP121-Sp2 (e) and mYFP:ZmPIP2;5 (f). (g) and (h) Protoplast coexpressing mCFP:AtSYP71-Sp2 (g) and mYFP:ZmPIP2;5 (h). (i) and (j) Protoplast coexpressing mCFP:AtSYP21-Sp2 (i) and mYFP:ZmPIP2;5 (j). (k) and (l) Protoplast coexpressing mCFP:AtSYP122-Sp2 (k) and mYFP:ZmPIP2;5 (l). All images were acquired with the same settings. In panel (a), autofluorescence of the chlorophyll a is shown, whereas in panels (c) to (k), chlorophyll a autofluorescence is subtracted. Bars = 5 µm. (B) Quantification of mYFP:ZmPIP2;5 fluorescence signal intensity in the protoplast plasma membrane (PM). Each bar represents the mean of three independent experiments (10 protoplasts per experiment). Error bars show the 95% confidence interval. Statistical differences were inferred by ANOVA, followed by the Tukey's honestly significant difference test. Means that are significantly different (P < 0.05) are indicated by different letters. a.u., arbitrary units.
Figure 3.
Figure 3.
Maize Mesophyll Protoplasts Coexpressing mCFP:ZmSYP121-Sp2 and mYFP:ZmPIP2;5 Phenocopies the Lower Plasma Membrane Water Permeability (Pf) of Arabidopsis syp121-1 Mesophyll Protoplasts. (A) Relative distribution of Pf values of maize mesophyll protoplasts untransfected or (co)expressing mYFP:ZmPIP2;5, mYFP:ZmPIP2;5 and mCFP:ZmSYP121, mYFP:ZmPIP2;5 and mCFP:SYP121-Sp2, or mCFP:ZmSYP121. (B) Median Pf values for each protoplast subpopulation shown in (A). (C) Relative distribution of Pf values of mesophyll protoplasts from wild-type (WT) and syp121 Arabidopsis plants. (D) Median Pf values for both Arabidopsis protoplast subpopulations. Each bar represents the mean of 20 measurements. Error bars show 95% confidence interval. Statistical differences were inferred by the Kruskall-Wallis test followed by a Dunns test or Mann-Whitney U test. Medians that are significantly different (P < 0.05) are shown with different letters.
Figure 4.
Figure 4.
ZmSYP121-Sp2 Decreases the Pf of Xenopus Oocytes When Coexpressed with Zm-PIP2;5. (A) Pf of Xenopus oocytes (co)expressing Venus:ZmPIP2;5, Venus:ZmPIP2;5 and 6His:ZmSYP121, Venus:ZmPIP2;5 and 6His:ZmSYP121-Sp2, or 6His:ZmSYP121 and 6His:ZmSYP121-Sp2 or oocytes injected with water (Mock). Each bar is the mean of 10 replicates. Error bars are 95% confidence intervals. Values were subjected to ANOVA and Tukey posthoc analysis. Means that are significantly different (P < 0.05) are indicated by different letters. (B) Confocal images of oocytes (co)expressing Venus:ZmPIP2;5 (a), Venus:ZmPIP2;5 and 6His:ZmSYP121 (b), (c) Venus:ZmPIP2;5 and 6His:ZmSYP121-Sp2, Venus:ZmSYP121 (d), or Venus:ZmSYP121-Sp2 (e), water-injected oocytes (f), or oocytes expressing Venus (g). The oocytes were fixed in 4% (w/v) paraformaldehyde and analyzed by CLSM. Note that all proteins mainly accumulated in the plasma membrane, except Venus:ZmSYP121-Sp2, which showed a localization pattern similar to that of Venus. Bars = 100 µm. (C) Relative Venus fluorescence signal intensity in the plasma membrane (M) compared with the cytoplasm (C) of oocytes expressing Venus:ZmPIP2;5, Venus:ZmPIP2;5, and 6His:ZmSYP121, Venus:ZmPIP2;5 and 6His:ZmSYP121-Sp2, Venus:ZmSYP121, Venus:ZmSYP121-Sp2, or Venus. Each bar is the mean of 20 replicates. Error bars are 95% confidence intervals. Values were subjected to ANOVA and Tukey posthoc analysis. Means that are significantly different (P < 0.05) are indicated by different letters. (D) Oocyte total protein extracts were probed with antibodies raised against AtSYP121. Protein extracts from oocytes expressing Venus:ZmPIP2;5 and 6His:ZmSYP121-Sp2 (a), 6His:ZmSYP121-Sp2 (b), Venus:ZmPIP2;5 and 6His:ZmSYP121 (c), 6His:ZmSYP121 (d), Venus:ZmSYP121 (e), or mock-injected sample (f). (E) Oocyte total protein extracts were probed with antibodies raised against Zm-PIP2;5. Protein extracts from oocytes expressing Venus:ZmPIP2;5 (a), Venus:ZmPIP2;5 and 6His:ZmSYP121 (b), and Venus:ZmPIP2;5 and 6His:ZmSYP121-Sp2 (c), or mock-injected sample (d). No DTT was added to the samples, meaning that only dimers of Venus:ZmPIP2;5 (∼125 kD) are detected.
Figure 5.
Figure 5.
Zm-SYP121 and Zm-PIP2;5 Interact Both in Oocytes and in Plant Cells. (A) and (B) Copurification of solubilized proteins extracted from Xenopus oocyte microsomal fractions on nickel–nitrilotriacetic acid resin. Elution fractions were probed with antibodies raised against Zm-PIP2;5 in (A) and against GFP in (B). Eluted fractions containing proteins extracted from oocytes expressing 6His:ZmPIP2;5 (a), 6His:ZmPIP2;5 and Venus:ZmSYP121 (b), and Venus:ZmSYP121 (c) or water-injected oocytes (d). (C) BiFC in maize epidermal cells and mesophyll protoplasts. (a) Confocal images of maize epidermal cells transiently expressing mYFP:ZmPIP2;5 and (b) stained with the plasma membrane stain, styryl dye FM4-64. (c) Colocalization was determined as the relative fluorescence intensities of mYFP and FM4-64 along the white dotted line. The black dotted line above the spectra represents the white dotted lines shown in (a) and (b). Note the matches between peaks for the two channels corresponding to plasma membranes. (d) to (g) Maize epidermal cells coexpressing mCFP:ZmSYP121 (d) and mYFP:ZmPIP2;5 (e). The plasma membrane was stained with FM4-64 (f). Merged image of mCFP:ZmSYP121, mYFP:ZmPIP2;5, and FM4-64 (g). (h) to (k) BiFC experiments in maize epidermal cells transfected by biolistic bombardment. Confocal images of epidermal cells expressing VenusN:ZmPIP2;5 and VenusC:ZmPIP1;2 (h), and VenusN:ZmPIP2;5 and VenusC:ZmSYP121 (i). (j) Bright field. (k) YFP channel of cells expressing VenusN:PMA2 and VenusC:ZmSYP121. (l) to (r) BiFC experiments in maize mesophyll protoplasts. Confocal images of protoplasts transiently coexpressing VenusN:ZmPIP2;5 and VenusC:ZmPIP1;2 ([l] and [m]) or VenusN:ZmPIP2;5 and VenusC:ZmSYP121 ([n] and [o]). (p) to (r) Protoplasts coexpressing VenusN:PMA2 and VenusC:ZmSYP121. (p) Chlorophyll a autofluorescence. (q) YFP channel. (r) Bright field. Bars = 20 μm in (a) to (k) and 5 μm in (l) to (r). a.u., arbitrary units. (D) Emission spectra after excitation at 514 nm of mYFP:ZmPIP2;5 (black solid line) and reconstituted Venus (gray dashed line). Fluorescent signal was collected from 517 to 683 nm with an interval of 9.8 nm. mYFP and reconstituted Venus share a similar emission pattern.
Figure 6.
Figure 6.
PIP2 Proteins Interact with SYP121 in Mating-Based Spilt-Ubiquitin Assay. (A) and (B) Mating-based split-ubiquitin assays were performed using At-PIP2;2 (A) and Zm-PIP2;5 (B) as baits, in each case with Zm-SYP121 and the Arabidopsis ortholog At-SYP121 as the prey. Diploid yeast containing the water channels as bait and the SNAREs as prey or Nub-moiety peptides (NubG = negative; NubI = positive control) were dropped in a dilution series (OD 1.0 and 0.1) onto the yeast synthetic media CSM-L-W- to verify mating and on CSM-L-, W-, Ura-, H-, M-, and Ade- containing increasing Met levels to repress expression of the bait. Yeast growth was recorded after incubation for 24 h (mating test) and for 48 h (interaction test) at 30°C. (C) Expression of bait and prey fusion proteins was verified using anti-SYP121 antibody (Tyrrell et al., 2007) and VP16 (Abcam) antibodies. Molecular masses of the primary bands in the protein gel blots are indicated below. Ponceau S staining (above) was recorded to monitor equal loading. The double bands are characteristic of the SNAREs (Geelen et al., 2002).
Figure 7.
Figure 7.
Hypothetical Models Summarizing the Regulation of Zm-PIP2;5 Trafficking and Activity by Zm-SYP121. (A) Regulation of Zm-PIP2;5 trafficking in plant cells coexpressing Zm-PIP2;5 and full-length Zm-SYP121. Constitutive recycling and delivery of newly synthesized Zm-PIP2;5 to the plasma membrane are regulated by SYP121 through Qa-SNARE/VAMP and direct interactions. SYP121 allows a proper docking of Zm-PIP2;5 at the plasma membrane and regulates its amount. (B) Regulation of Zm-PIP2;5 trafficking in plant cells coexpressing Zm-PIP2;5 and the ZmSYP121-Sp2 fragment. (a) The dominant-negative mutant SYP121-Sp2 might bind to Zm-PIP2;5 proteins, altering their water channel activity and preventing their interaction with full-length SYP121. (b) Constitutive recycling and delivery of newly synthesized Zm-PIP2;5 to the plasma membrane are altered by the binding of SYP121-Sp2 to VAMP and Zm-PIP2;5. This interaction does not allow SNARE complex formation and the fusion of vesicles carrying Zm-PIP2;5 cargo to the plasma membrane. Additionally, SYP121-Sp2 might bind resident ZmPIP2;5 proteins and inhibit their water transport activity. See text for additional explanations.

References

    1. Batoko H., Zheng H.Q., Hawes C., Moore I. (2000). A rab1 GTPase is required for transport between the endoplasmic reticulum and Golgi apparatus and for normal Golgi movement in plants. Plant Cell 12: 2201–2218 - PMC - PubMed
    1. Bellati J., Alleva K., Soto G., Vitali V., Jozefkowicz C., Amodeo G. (2010). Intracellular pH sensing is altered by plasma membrane PIP aquaporin co-expression. Plant Mol. Biol. 74: 105–118 - PubMed
    1. Bhat R.A., Miklis M., Schmelzer E., Schulze-Lefert P., Panstruga R. (2005). Recruitment and interaction dynamics of plant penetration resistance components in a plasma membrane microdomain. Proc. Natl. Acad. Sci. USA 102: 3135–3140 - PMC - PubMed
    1. Bienert G.P., Bienert M.D., Jahn T.P., Boutry M., Chaumont F. (2011). Solanaceae XIPs are plasma membrane aquaporins that facilitate the transport of many uncharged substrates. Plant J. 66: 306–317 - PubMed
    1. Bienert G.P., Cavez D., Besserer A., Berny M.C., Gilis D., Rooman M., Chaumont F. (2012). A conserved cysteine residue is involved in disulfide bond formation between plant plasma membrane aquaporin monomers. Biochem. J. 445: 101–111 - PubMed

Publication types

MeSH terms

LinkOut - more resources