. 2012 Sep 1;35(9):1209-22.
doi: 10.5665/sleep.2072.

Lactate as a biomarker for sleep

Affiliations

Lactate as a biomarker for sleep

Erik Naylor et al. Sleep. .

Abstract

Study objectives: An ideal biomarker for sleep should change rapidly with sleep onset, remain at a detectably differential level throughout the sleep period, and exhibit a rapid change with waking. Currently, no molecular marker has been identified that exhibits all three properties. This study examined three substances (lactate, glucose, and glutamate) for suitability as a sleep biomarker.

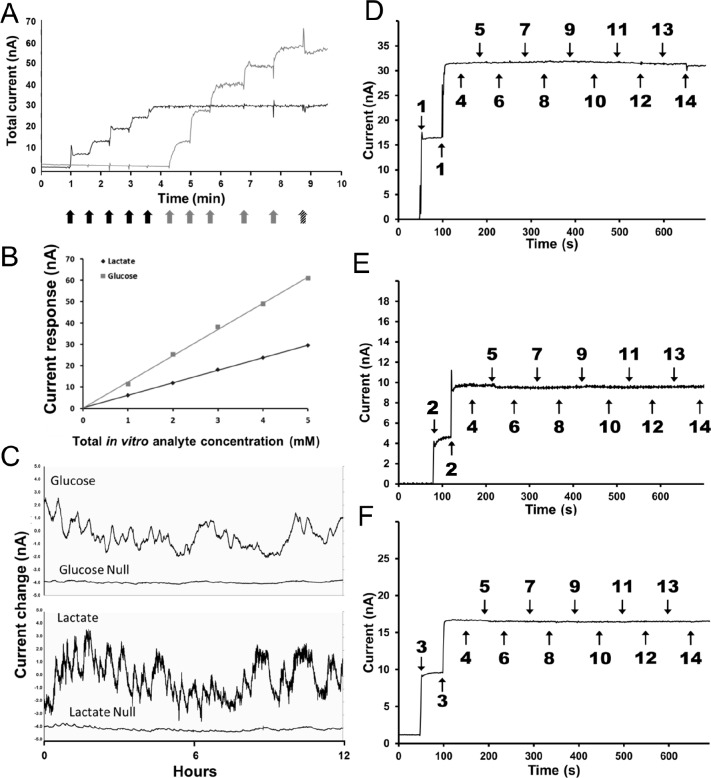
Design: Using amperometric biosensor technology in conjunction with electroencephalograph (EEG) and electromyograph (EMG) monitoring, extracellular concentrations of lactate and glucose (Cohort 1) as well as lactate and glutamate (Cohort 2) were recorded over multiple sleep/wake cycles.

Patients or participants: There were 12 C57Bl/6J male mice (3-5 mo old).

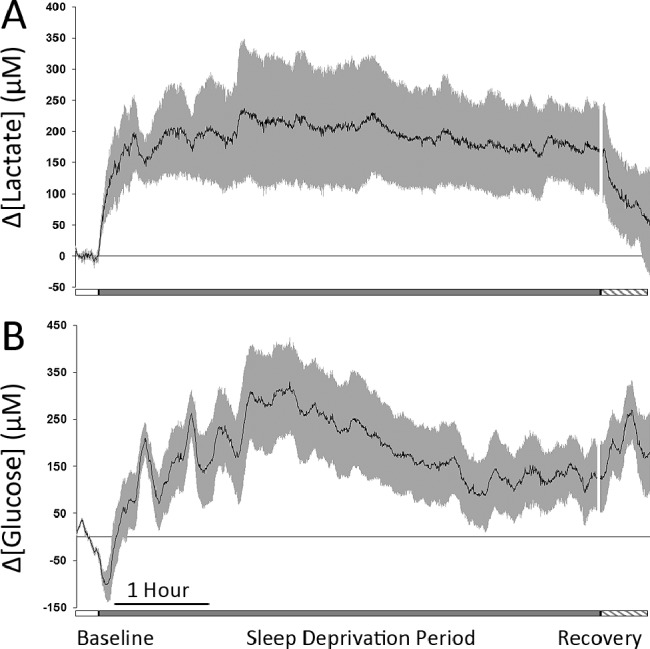
Interventions: Sleep and waking transitions were identified using EEG recordings. Extracellular concentrations of lactate, glucose, and glutamate were evaluated before and during transition events as well as during extended sleep and during a 6-h sleep deprivation period.

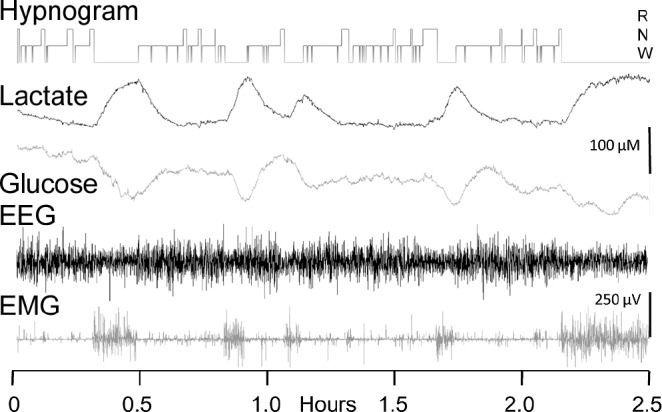
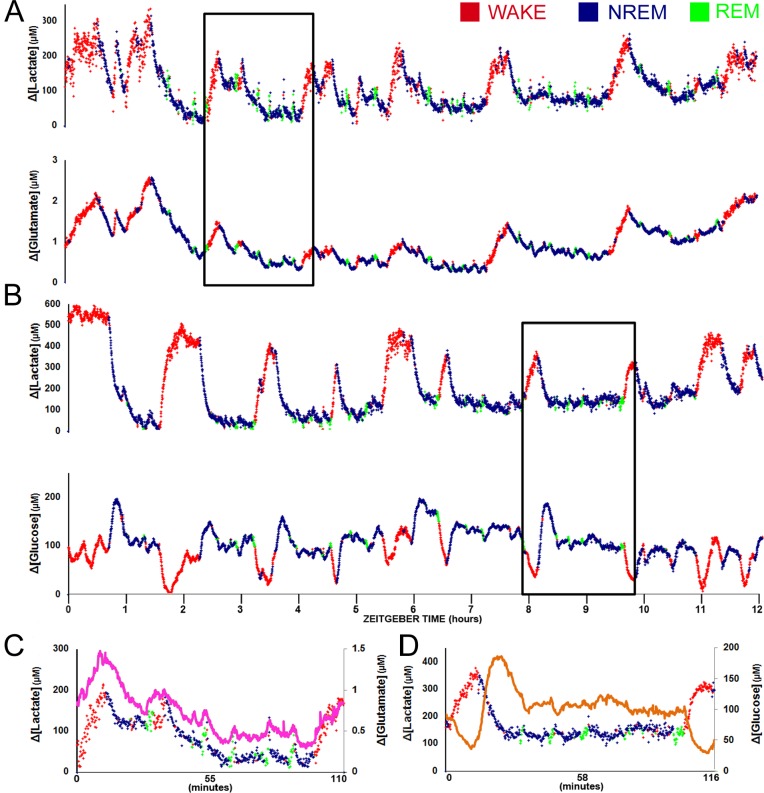
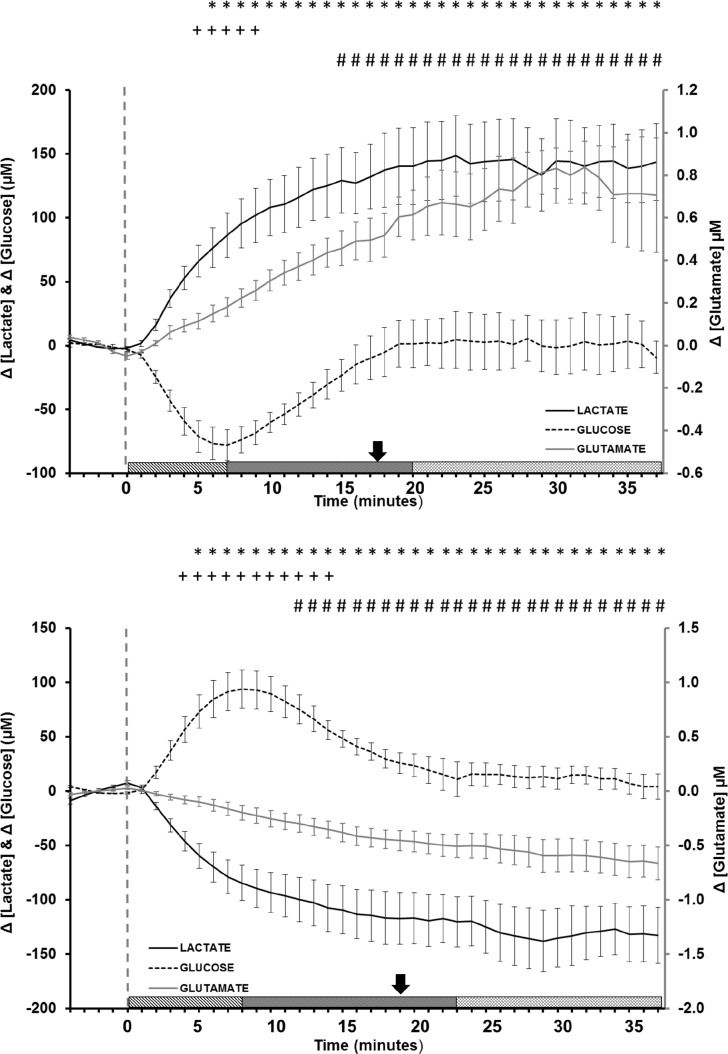
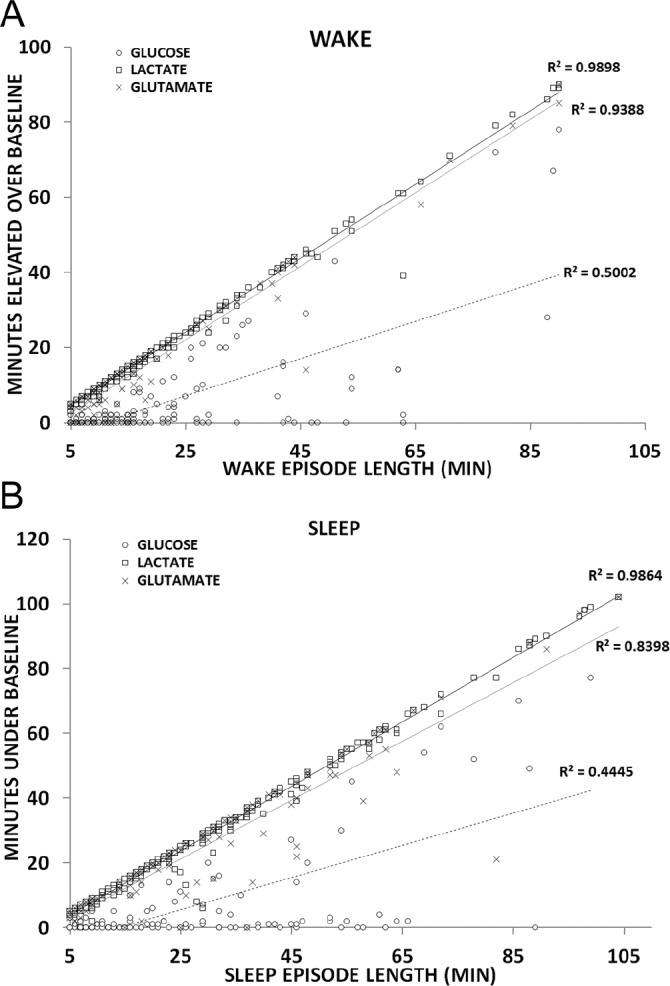
Measurements and results: Rapid and sustained increases in cortical lactate concentration (approximately 15 μM/min) were immediately observed upon waking and during rapid eye movement sleep. Elevated lactate concentration was also maintained throughout a 6-h period of continuous waking. A persistent and sustained decline in lactate concentration was measured during nonrapid eye movement sleep. Glutamate exhibited similar patterns, but with a much slower rise and decline (approximately 0.03 μM/min). Glucose concentration changes did not demonstrate a clear correlation with either sleep or wake.

Conclusions: These findings indicate that extracellular lactate concentration is a reliable sleep/wake biomarker and can be used independently of the EEG signal.

Keywords: Biosensor; continuous in vivo monitoring; electroencephalography; electromyography; glucose; glutamate; lactate; mouse; sleep.


Figures

Figure 1
Figure 1
(A) Post-calibration curve for both a lactate (black trace) and a glucose (gray trace) sensor implanted in a mouse. Black arrows indicate addition of 0.1 mM lactate, gray arrows indicate addition of 1mM glucose, and the hatched arrow indicates 250 mM ascorbic acid addition. (B) Linearity of the sensor response to both lactate and glucose additions. (C) Simultaneous recording of active sensors for glucose and lactate along with the null sensors for each analyte implanted contralaterally within the same animal. Typical in vitroInterference test plots for biosensors: lactate (D), glutamate (E), and glucose (F). Biosensors were calibrated in 100 mM phosphate buffered saline (pH 7.4) at 37°C. The addition of analytes and interferents shown on the plots are as follows: (1) L-lactate 0.1 mM, (2) L-glutamate 10 μM, (3) D-glucose 1.0 mM, (4) norepinephrine 1.0 μM, (5) serotonin 1.0 μM, (6) dopamine 1.0 μM, (7) gamma-amino-butyric acid 1.0 μM, (8) tryptophan 2.0 μM, (9) L-cysteine 2.0 μM, (10) L-tyrosine 2.0 μM, (11) L-glutathione 2.0 μM, (12) L-glutamine 2.0 μM, (13) L-aspartic acid 2.0 μM, and (14) L-ascorbic acid 250 μM.
Figure 2
Figure 2
Histologic slice showing sensor placement (left) and corresponding stereotaxic atlas page (right).
Figure 3
Figure 3
Data traces showing simultaneous, synchronized lactate and glucose biosensor traces along with corresponding electroencephalographic and electromyographic activity over a 2.5-h period. A hypnogram indicating scored sleep/wake states is displayed at the top of the traces. The biosensor traces are plotted uncorrected for sensor drift.
Figure 4
Figure 4
Multiple sleep/wake cycles recorded using simultaneous electroencephalographic and (A) lactate/glutamate biosensors or (B) lactate/glucose biosensors plotted during the lights-on period. Epochs scored as wake are noted in red, non-rapid eye movement (NREM) sleep epochs are colored blue, and rapid eye movement (REM) sleep epochs are indicated in green. Concentration change for each analyte is indicated on the y-axis. The lower graphs (C, D) correspond to time periods on the upper graphs indicted by the solid box. In all expanded graphs, lactate concentration change is plotted in a manner similar to that of the large-scale graphs with colors indicating sleep/wake state and the secondary analyte (C) glutamate or (D) glucose plotted as on overlay in fuchsia or orange, respectively.
Figure 5
Figure 5
Average concentration change as a function of time for lactate (solid black line), glucose (dashed black line), and glutamate (solid gray line) during (A) wake and (B) sleep episodes longer than 15 min. The baseline comparison period was calculated using the average value from the 5 min immediately preceding stage onset (vertical dashed gray line). Symbols indicate P < 0.05 (*lactate, +glucose, #glutamate) over each analyte's calculated baseline (Tukey post hoc). Bars represent standard error of the mean. The patterned bars at the bottom represent the three response phases for glucose: initiation phase (IP), transition phase (TP), and equilibrium phase (EP). The arrow directly above the bars represents the transition from the IP to the EP for lactate and glutamate.
Figure 6
Figure 6
Correlational analysis between wake episode length and concentration changes for lactate (▫), glucose (○) and glutamate (×) for all (A) wake or (B) sleep periods longer than 5 min.
Figure 7
Figure 7
(A) Average lactate concentration change in five animals during 15 min baseline (open bar), 6-h of enforced sleep deprivation (gray bar), and 30 min of recovery sleep (hatched bar). (B) Average glucose concentration change in five animals during 15 min baseline (open bar) and 6-h of enforced sleep deprivation (gray bar). In both graphs, the black line indicates the mean change in concentration from baseline values and the gray bars indicate standard error of the mean.

References

    1. Naylor E, Aillon DV, Gabbert S, et al. Simultaneous real-time measurement of EEG/EMG and L-glutamate in mice: a biosensor study of neuronal activity during sleep. J Electroanal Chem. 2011;656:106–13. - PMC - PubMed
    1. Dash MB, Douglas CL, Vyazovskiy VV, Cirelli C, Tononi G. Long-term homeostasis of extracellular glutamate in the rat cerebral cortex across sleep and waking states. J Neurosci. 2009;29:620–9. - PMC - PubMed
    1. John J, Ramanathan L, Siegel JM. Rapid changes in glutamate levels in the posterior hypothalamus across sleep-wake states in freely behaving rats. Am J Physiol Regul Integr Comp Physiol. 2008;295:R2041–9. - PMC - PubMed
    1. Netchiporouk L, Shram N, Salvert D, Cespuglio R. Brain extracellular glucose assessed by voltammetry throughout the rat sleep-wake cycle. Eur. J. Neurosci. 2001;13:1429–34. - PubMed
    1. Shram N, Netchiporouk L, Cespuglio R. Lactate in the brain of the freely moving rat: voltammetric monitoring of the changes related to the sleep-wake states. Eur J Neurosci. 2002;16:461–6. - PubMed

Publication types