Review
. 2012;13(7):8398-8429.
doi: 10.3390/ijms13078398. Epub 2012 Jul 6.

Function and 3D structure of the N-glycans on glycoproteins

Affiliations
Review

Function and 3D structure of the N-glycans on glycoproteins

Masamichi Nagae et al. Int J Mol Sci. 2012.

Abstract

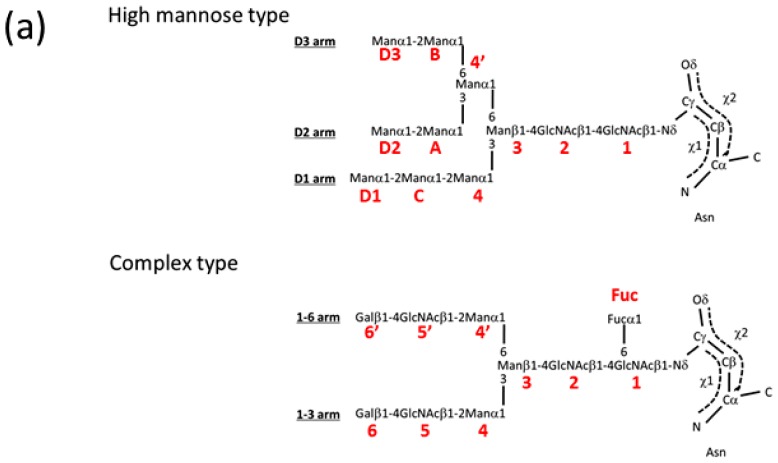
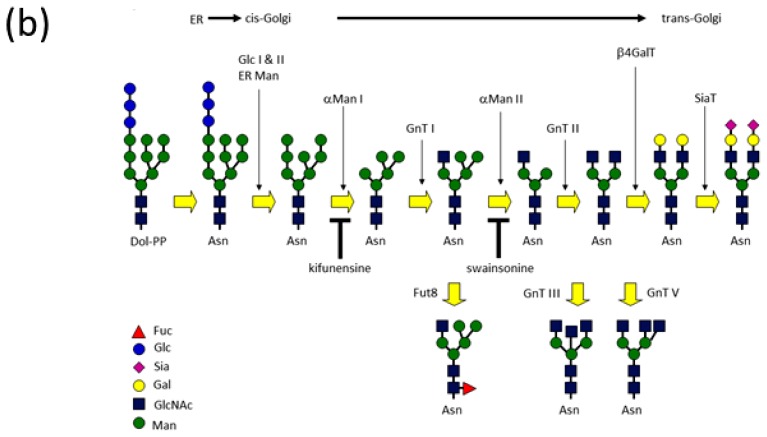
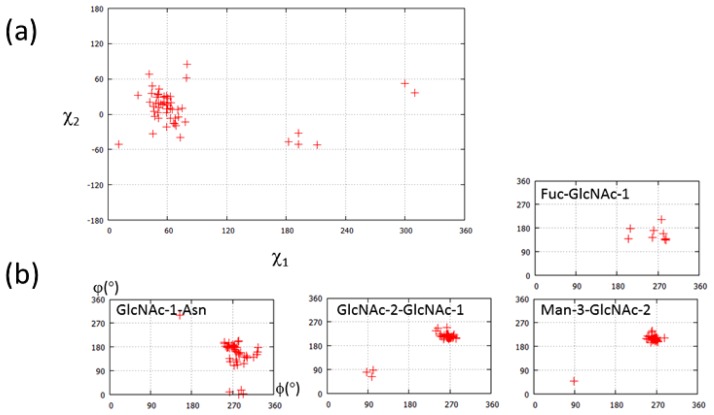
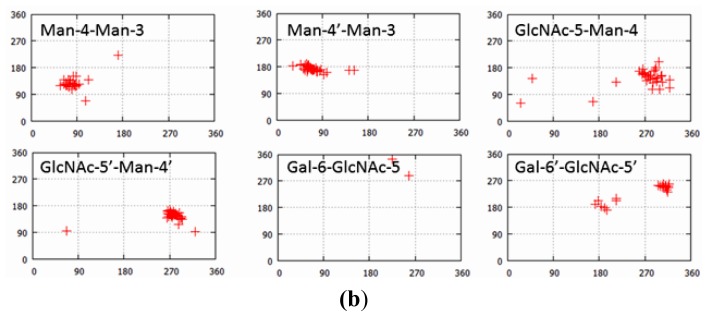
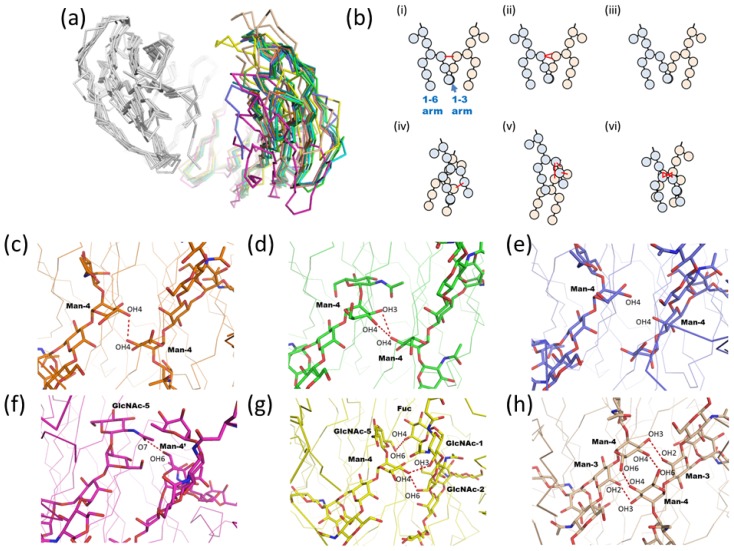
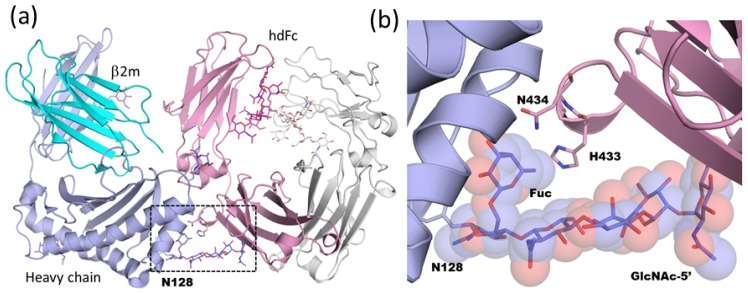
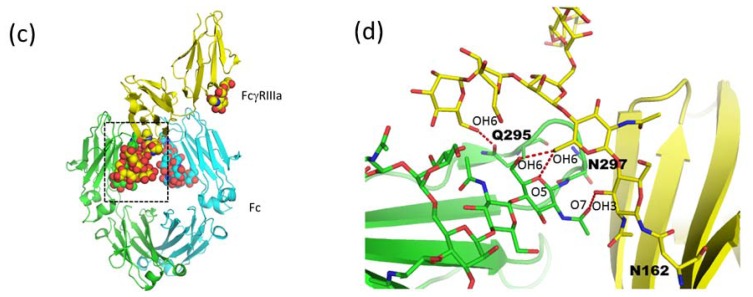
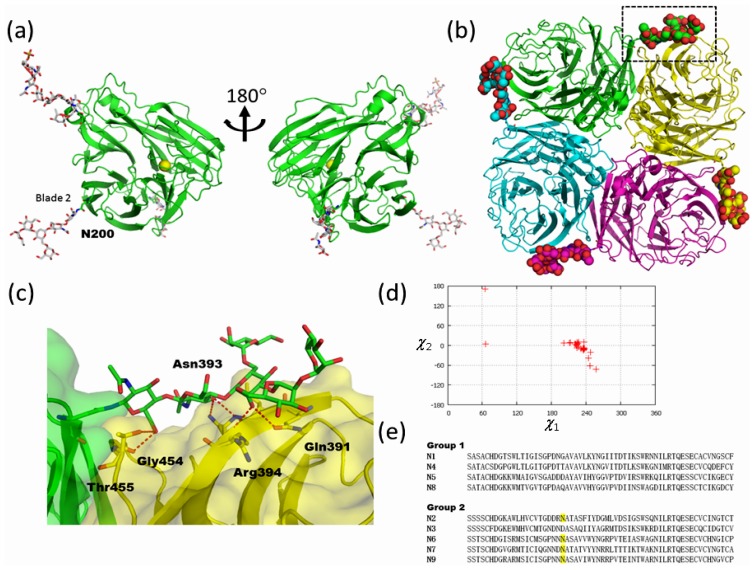
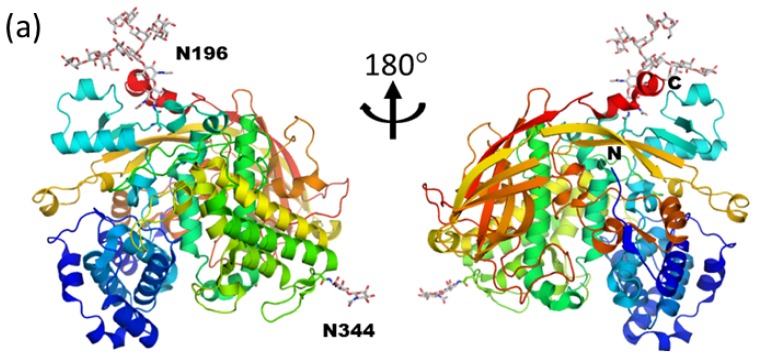
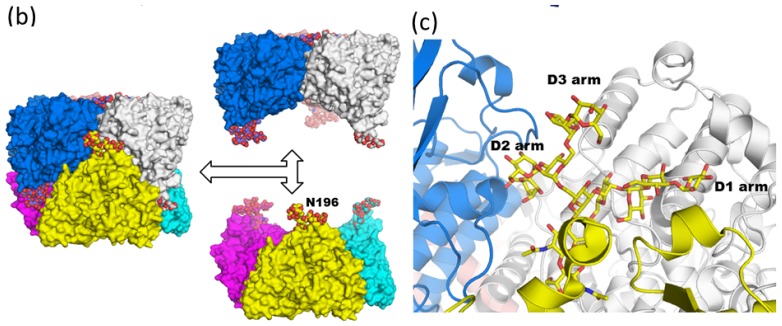
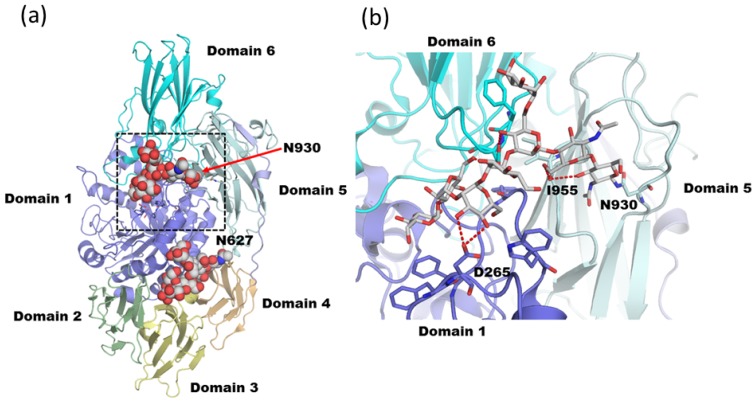
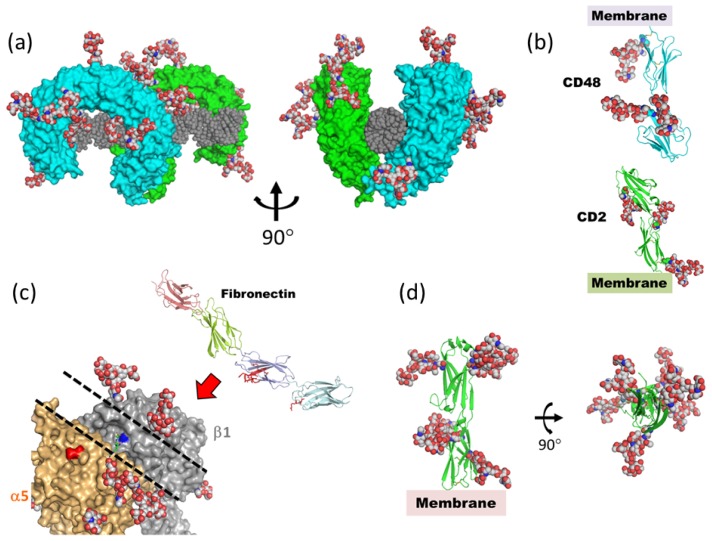
Glycosylation is one of the most common post-translational modifications in eukaryotic cells and plays important roles in many biological processes, such as the immune response and protein quality control systems. It has been notoriously difficult to study glycoproteins by X-ray crystallography since the glycan moieties usually have a heterogeneous chemical structure and conformation, and are often mobile. Nonetheless, recent technical advances in glycoprotein crystallography have accelerated the accumulation of 3D structural information. Statistical analysis of "snapshots" of glycoproteins can provide clues to understanding their structural and dynamic aspects. In this review, we provide an overview of crystallographic analyses of glycoproteins, in which electron density of the glycan moiety is clearly observed. These well-defined N-glycan structures are in most cases attributed to carbohydrate-protein and/or carbohydrate-carbohydrate interactions and may function as "molecular glue" to help stabilize inter- and intra-molecular interactions. However, the more mobile N-glycans on cell surface receptors, the electron density of which is usually missing on X-ray crystallography, seem to guide the partner ligand to its binding site and prevent irregular protein aggregation by covering oligomerization sites away from the ligand-binding site.

Keywords: N-glycan; glycoform; glycoprotein; protein crystallography.


Figures

Figure 1
Figure 1
(a) Representative chemical structures of high-mannose and complex-type N-glycans. (b) N-glycan processing pathways in mammalian cells. The enzymes and structures of intermediate N-glycans are shown. Glc I, α-glucosidase I; Glc II, α-glucosidase II; ER Man, ER α-mannosidase; α-ManI, α-mannosidase I; GnT I, β-N-acetylglucosaminyltransferase I; α-ManII, α-mannosidase II; GnT II, β-N-acetylglucosaminyltransferase II; β4GalT, β-1,4-galactosyltransferase; SiaT, sialyltransferase; GnT III, β-N-acetylglucosaminyltransferase III; GnT V, β-N-acetylglucosaminyltransferase V; and α1,6-fucosyltransferase, Fut8.
Figure 1
Figure 1
(a) Representative chemical structures of high-mannose and complex-type N-glycans. (b) N-glycan processing pathways in mammalian cells. The enzymes and structures of intermediate N-glycans are shown. Glc I, α-glucosidase I; Glc II, α-glucosidase II; ER Man, ER α-mannosidase; α-ManI, α-mannosidase I; GnT I, β-N-acetylglucosaminyltransferase I; α-ManII, α-mannosidase II; GnT II, β-N-acetylglucosaminyltransferase II; β4GalT, β-1,4-galactosyltransferase; SiaT, sialyltransferase; GnT III, β-N-acetylglucosaminyltransferase III; GnT V, β-N-acetylglucosaminyltransferase V; and α1,6-fucosyltransferase, Fut8.
Figure 2
Figure 2
(a) Overall structure of immunoglobulin G (PDB code; 1igt) is shown in a ribbon model. One light and two heavy chains are shown in beige, blue and cyan, respectively. Carbohydrate residues attached on the Fc region are shown in sphere models. (b) Close-up view of Asn297 attached glycan of human IgG1 Fc (PDB code; 2dts). Carbohydrate moiety and amino acid residues which interact with N-glycan are shown in the rod model. Hydrogen bonds between protein and carbohydrate are shown as red dotted lines.
Figure 3
Figure 3
(a) The side-chain torsions of Asn297 of the Fc fragment. Torsion angles of the Asn297 side chain are measured by MolProbity [52]. We excluded Fc with high-mannose type glycan (PDB code 2wah) from this inspection, since this structure contains high-mannose type glycans. (b) Comparison of glycosidic torsions of N-glycan attached on Asn297 of Fc fragment. Dihedral angles of each linkage are calculated with CARP [15]. The vertical and horizontal axes indicate ϕ and φ angles, respectively. The residues with errors are carefully excluded from this analysis. In many cases, a β1-6 linkage is erroneously used between core Fuc and GlcNAc instead of an α1-6 bond [53]. Eight entries are plotted in Fuc-GlcNAc-1 (PDB code; 1h3w, 3ave, 3d6g, 2rgs, chain-A in 1e4k, and chain-B in 3sgj).
Figure 3
Figure 3
(a) The side-chain torsions of Asn297 of the Fc fragment. Torsion angles of the Asn297 side chain are measured by MolProbity [52]. We excluded Fc with high-mannose type glycan (PDB code 2wah) from this inspection, since this structure contains high-mannose type glycans. (b) Comparison of glycosidic torsions of N-glycan attached on Asn297 of Fc fragment. Dihedral angles of each linkage are calculated with CARP [15]. The vertical and horizontal axes indicate ϕ and φ angles, respectively. The residues with errors are carefully excluded from this analysis. In many cases, a β1-6 linkage is erroneously used between core Fuc and GlcNAc instead of an α1-6 bond [53]. Eight entries are plotted in Fuc-GlcNAc-1 (PDB code; 1h3w, 3ave, 3d6g, 2rgs, chain-A in 1e4k, and chain-B in 3sgj).
Figure 4
Figure 4
(a) Structural comparison between high-mannose glycan (PDB code; 2wah, green) and complex-type glycan (PDB code; 2dts, cyan). (b) Structural superposition between high-mannose type Fc fragment (green) and complex-type Fc fragment (cyan). Protein molecules and carbohydrate chains are shown in wire and stick models, respectively. The positions of Asn297 are indicated by red asterisks. Structural superposition of crystal structures were performed by the program SUPERPOSE [56].
Figure 5
Figure 5
(a) Structural superposition of 10 Fc fragment structures (1fc1; green, 1h3v; cyan, 1h3y; magenta, 1i1c; yellow, 2dts; pink, 1i1c; yellow, 2rgs; wheat, 2vuo; slate, 3ave; orange, 3do3; lime, 3fjt; deep teal). For four entries (PDB code; 1h3w, 3c2s, 2ql1, and 1l6x), the asymmetric units of these crystals contain only one heavy chain. Thus, the symmetry-related neighboring heavy chains were compensated for in this analysis. Structural superposition was performed by SUPERPOSE. (b) Schematic representation of six types of carbohydrate-carbohydrate interaction modes. N-glycans of two chains are shown in blue and pink. Hydrogen bonds are shown as red lines. (c)–(h) Close-up views of the interfaces of carbohydrate-carbohydrate interactions. Carbohydrate moiety is shown in the rod model. Hydrogen bonds between carbohydrates are shown as red dotted lines. The structural superimposition of four structures which have only one carbohydrate-carbohydrate interaction is shown in (c). Human IgG1 Fc fragment (PDB code; 1fc1) is shown in (d). The superimposition of two structures which have no interaction between glycans is shown in (e). Human IgG1 Fc in high salt condition (PDB code; 1h3y), rat IgG2a (PDB code; 1i1c), and mouse IgG2b Fc fragment (PDB code; 2rgs) are shown in (f), (g), and (h), respectively.
Figure 6
Figure 6
(a) Overall structure of neonatal Fc receptor (FcRn) in complex with heterodimeric Fc (hdFc) (PDB code; 1i1a). Heavy chain and soluble light chain β2-microglobulin (β2m) of FcRn are shown in slate and cyan, respectively. Proximal and distal Fc fragments of hdFc are shown in pink and white, respectively. The region delineated in black dotted lines is magnified in (b). (b) Close-up view of FcRn-hdFc complex. N-glycan attached at Asn128 of FcRn is shown in rod and semitransparent sphere model. (c) Overall structure of human Fc-glycosylated human Fcγ receptor IIIa (FcγRIIIa) complex (PDB code; 3sgk). Two chains of Fc fragment and FcγRIIIa are shown in green, cyan, and yellow, respectively. The region delineated in black dotted lines is magnified in (d). (d) Close-up view of carbohydrate-carbohydrate interaction in Fc-FcγRIIIa. Hydrogen bonds are shown as red dotted lines.
Figure 6
Figure 6
(a) Overall structure of neonatal Fc receptor (FcRn) in complex with heterodimeric Fc (hdFc) (PDB code; 1i1a). Heavy chain and soluble light chain β2-microglobulin (β2m) of FcRn are shown in slate and cyan, respectively. Proximal and distal Fc fragments of hdFc are shown in pink and white, respectively. The region delineated in black dotted lines is magnified in (b). (b) Close-up view of FcRn-hdFc complex. N-glycan attached at Asn128 of FcRn is shown in rod and semitransparent sphere model. (c) Overall structure of human Fc-glycosylated human Fcγ receptor IIIa (FcγRIIIa) complex (PDB code; 3sgk). Two chains of Fc fragment and FcγRIIIa are shown in green, cyan, and yellow, respectively. The region delineated in black dotted lines is magnified in (d). (d) Close-up view of carbohydrate-carbohydrate interaction in Fc-FcγRIIIa. Hydrogen bonds are shown as red dotted lines.
Figure 7
Figure 7
High-mannose type glycan of influenza neuraminidase assists tetramer formation. (a) Overall structure of monomeric influenza N2 neuraminidase (PDB code; 1nn2). Protein, carbohydrate, and calcium ion are shown in ribbon, stick, and sphere models, respectively. (b) Tetrameric structure of influenza N2 neuraminidase (PDB code; 1nn2). N-linked glycans at Asn200 are shown in sphere models. The region delineated in black dotted lines is magnified in (c). (c) Close-up view of N-glycan at Asn200 and symmetry related molecule. Hydrogen bonds are shown in red dotted lines. (d) The side-chain torsion angles of Asn200 of N2, Asn207 of N6, and Asn200 of N9 NA (Asn201 in PDB code; 2b8h). (e) Amino acid sequence alignment of group 1 and 2 influenza neuraminidase around Asn200 glycosylation sites. Putative N-linked glycosylation sites in group 2 are highlighted.
Figure 8
Figure 8
Immature monoglucosylated N-glycan on Antheraea pernyi arylphorin (PDB code; 3gwj) (a) Overall structure of monomeric APA. Protein and carbohydrate are shown in ribbon and rod models, respectively. (b) Hexameric structure of APA. Each monomer is shown in surface model. The attached N-linked glycans at Asn196 are shown in spheres. (c) Close-up view of Asn196-attached N-glycan in hexameric APA.
Figure 8
Figure 8
Immature monoglucosylated N-glycan on Antheraea pernyi arylphorin (PDB code; 3gwj) (a) Overall structure of monomeric APA. Protein and carbohydrate are shown in ribbon and rod models, respectively. (b) Hexameric structure of APA. Each monomer is shown in surface model. The attached N-linked glycans at Asn196 are shown in spheres. (c) Close-up view of Asn196-attached N-glycan in hexameric APA.
Figure 9
Figure 9
Immature diglucosylated N-glycan on β-galactosidase from Trichoderma reesei (a) Overall structure of Tr-β-gal (PDB code; 3ogv). N-linked glycan at Asn627 and Asn930 are shown in sphere models. The region delineated in black dotted lines is magnified in (b). (b) Close-up view of Asn930 attached glycan. Hydrogen bonds are shown as red dotted lines.
Figure 10
Figure 10
Highly flexible N-glycans on cell surface receptors. Complex-type N-glycans (GlcNAc2Man3GlcNAc2Fuc) are superimposed, based on the position of chitobiose or sequons by using LSQKAB [103]. (a) Fully glycosylated Toll-like receptor-3 (TLR3) ectodomain in complex with dsRNA (PDB code; 3ciy). Protein molecules are shown as green and cyan surface models. dsRNA is shown as a gray sphere. (b) Extracellular domains of CD2 (PDB code; 1hnf) and CD48 (PDB code; 2dru). (c) Crystal structure of α5β1 integrin ectodomain (PDB code; 3vi4) and fibronectin FN7-10 fragment (PDB code; 1fnf). In the fibronectin structure, the amino acid residues which interact with α5β1 integrin are shown in red stick model. Dashed lines on α5β1 integrin outline the shallow groove formed by N-glycans. (d) Intercellular cell adhesion molecule (ICAM)-2 ectodomains (PDB code; 1zxq).

References

    1. Helenius A., Aebi M. Intracellular functions of N-linked glycans. Science. 2001;291:2364–2369. - PubMed
    1. Apweiler R., Hermjakob H., Sharon N. On the frequency of protein glycosylation, as deduced from analysis of the SWISS-PROT database. Biochim. Biophys. Acta. 1999;1473:4–8. - PubMed
    1. Nishikawa A., Ihara Y., Hatakeyama M., Kangawa K., Taniguchi N. Purification, cDNA cloning, and expression of UDP-N-acetylglucosamine:β-d-mannoside β-1,4-Nacetylglucosaminyltransferase III from rat kidney. J. Biol. Chem. 1992;267:18199–18204. - PubMed
    1. Cummings R.D., Trowbridge I.S., Kornfeld S. A mouse lymphoma cell line resistant to the leukoagglutinating lectin from Phaseolus vulgaris is deficient in UDP-GlcNAc:α-d-mannoside- β-1,6-N-acetylglucosaminyltransferase. J. Biol. Chem. 1982;257:13421–13427. - PubMed
    1. Uozumi N., Yanagidani S., Miyoshi E., Ihara Y., Sakuma T., Gao C.X., Teshima T., Fujii S., Shiba T., Taniguchi N. Purification and cDNA cloning of porcine brain GDP-l-Fuc:Nacetyl- β-d-glucosaminide α1→6 fucosyltransferase. J. Biol. Chem. 1996;271:27810–27817. - PubMed

LinkOut - more resources