Review
. 2012 Apr;2(2):863-914.
doi: 10.1002/cphy.c110024.

Role of monosaccharide transport proteins in carbohydrate assimilation, distribution, metabolism, and homeostasis

Affiliations
Review

Role of monosaccharide transport proteins in carbohydrate assimilation, distribution, metabolism, and homeostasis

Anthony J Cura et al. Compr Physiol. 2012 Apr.

Abstract

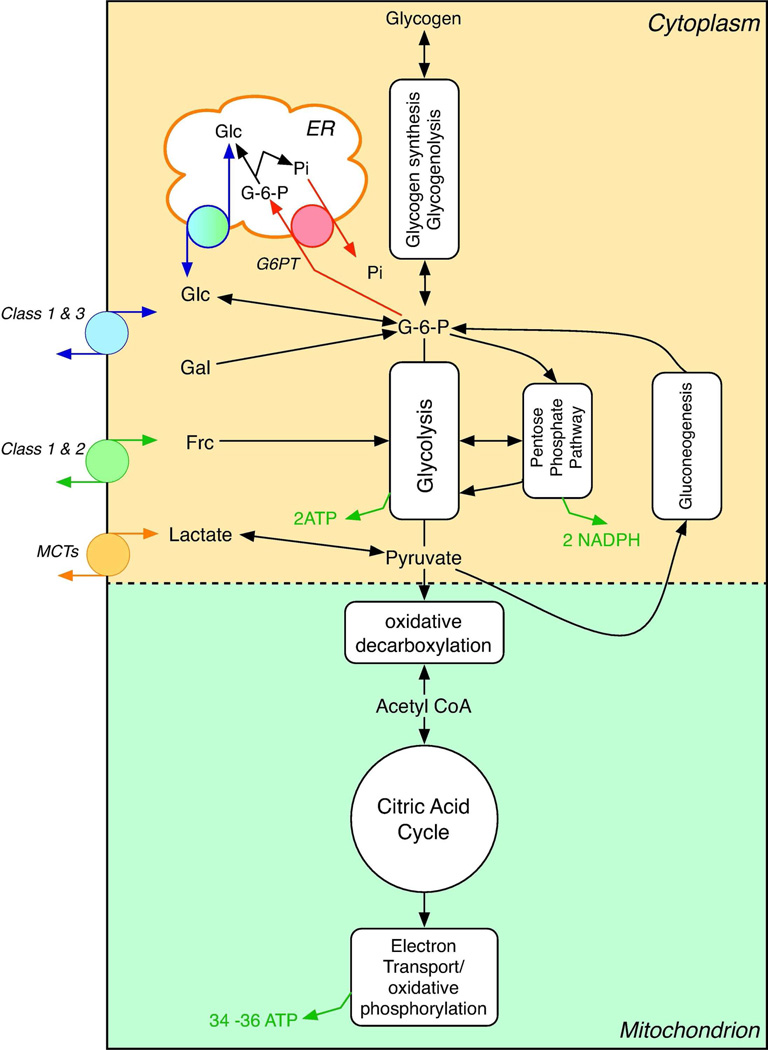
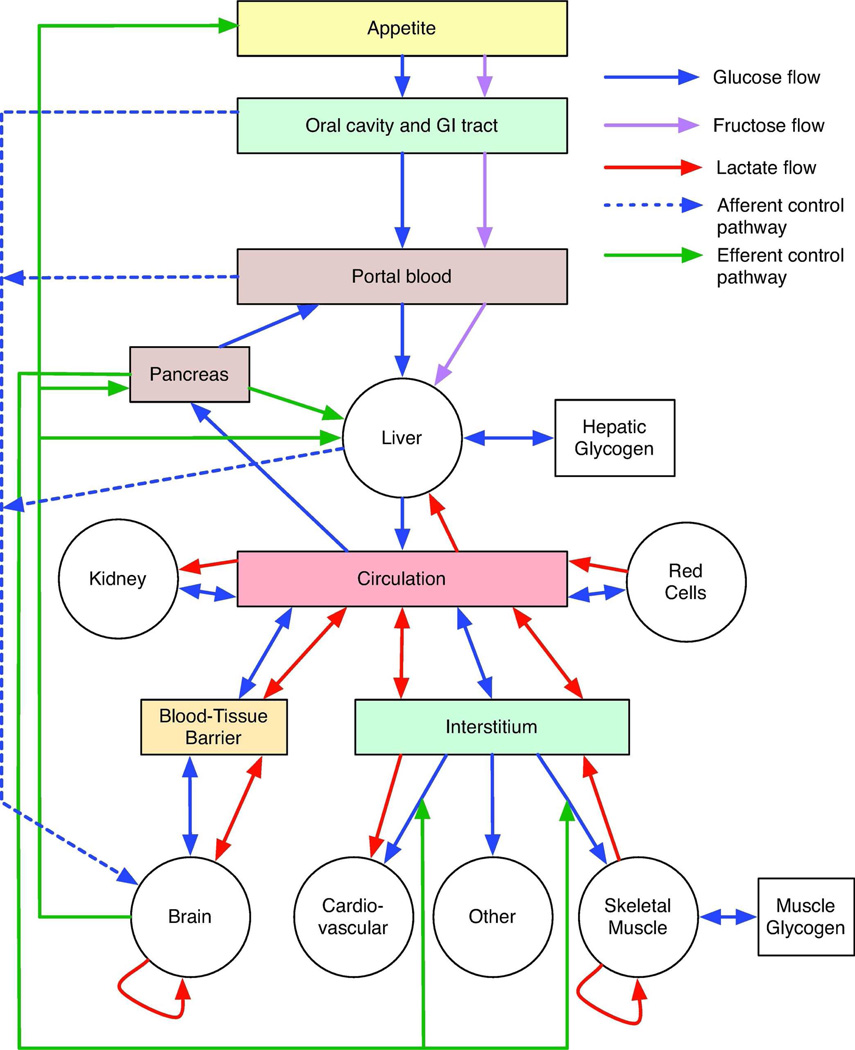
The facilitated diffusion of glucose, galactose, fructose, urate, myoinositol, and dehydroascorbicacid in mammals is catalyzed by a family of 14 monosaccharide transport proteins called GLUTs. These transporters may be divided into three classes according to sequence similarity and function/substrate specificity. GLUT1 appears to be highly expressed in glycolytically active cells and has been coopted in vitamin C auxotrophs to maintain the redox state of the blood through transport of dehydroascorbate. Several GLUTs are definitive glucose/galactose transporters, GLUT2 and GLUT5 are physiologically important fructose transporters, GLUT9 appears to be a urate transporter while GLUT13 is a proton/myoinositol cotransporter. The physiologic substrates of some GLUTs remain to be established. The GLUTs are expressed in a tissue specific manner where affinity, specificity, and capacity for substrate transport are paramount for tissue function. Although great strides have been made in characterizing GLUT-catalyzed monosaccharide transport and mapping GLUT membrane topography and determinants of substrate specificity, a unifying model for GLUT structure and function remains elusive. The GLUTs play a major role in carbohydrate homeostasis and the redistribution of sugar-derived carbons among the various organ systems. This is accomplished through a multiplicity of GLUT-dependent glucose sensing and effector mechanisms that regulate monosaccharide ingestion, absorption,distribution, cellular transport and metabolism, and recovery/retention. Glucose transport and metabolism have coevolved in mammals to support cerebral glucose utilization.


Figures

FIGURE 1
FIGURE 1. Putative GLUT1 topology and helix packing
GLUT1 topology adapted from the GlpT homology model (508). Group 1 TMs are highlighted in pink. Group 2 and Group 3 TMs are highlighted in blue and green respectively. Some TMs extend beyond the bilayer boundaries (indicated by horizontal yellow rectangle). The bilayer-embedded region of TMs 1–12 comprise amino acids 17–39, 64 – 86, 93–112, 120 –141, 157–178, 187–207, 267–291, 305–325, 335–356, 362–385, 401–421, and 431–452, respectively. GLUT1 is glycosylated at Asn45. TMs 6 and 7 are linked by the large cytoplasmic loop (L6 –7). Amino acid residues are show using 1 letter code. The key indicates residues that are accessible to a variety of agents. The red, green and purple residues indicate residues which when mutagenized to cysteine are reactive with exofacial pCMBS, whose labeling by pCMBS is protected by substrate or whose substitution causes transport inhibition respectively (441). The yellow residues indicate those native cysteine that are accessible to alkylation by iodoacetamide (62). The orange residues are predicted to be important in ligand binding based on docking studies (141, 508). The dark blue residues are important in substrate binding as judged by mutagenesis studies (399). The black residues are known to be modified in GLUT1 deficiency syndrome (haploinsufficiency) (319). The light blue residues are accessible in native GLUT1 to trypsin and NHS-esters (62).
FIGURE 2
FIGURE 2. Putative GLUT1 homology modeled structure
adapted from the GlpT homology model (508) and analyzed using the software program VMD 1.8.5 (© University of Illinois 2006). GLUT1 coordinates were obtained from the RCSB Protein Data Bank (entry No. 1SUK). A. GLUT1 viewed as a membrane spanning protein along the bilayer plane. The limits of the bilayer are indicated by the dashed lines. Membrane spanning helices (TMs) are color coded as in Figure 1. B, putative helix packing arrangement viewed from the cytoplasmic surface. TMs are numbered and colored as in 2A. Cytoplasmic and exofacial loops are indicated by solid and dashed linesrespectively. A scale bar (5 nm) is indicated.
FIGURE 3
FIGURE 3. Biochemical analysis of GLUT1 topography
Membrane-resident GLUT1 was digested with trypsin or, following labeling with NHS-LC-biotin by α-chymotrypsin and then analyzed by reverse phase HPLC-ESI-MS/MS(62). Peptides containing the indicated cleavage sites were positively identified by MS/MS. The 12 TMs are indicated in schematic form relative to the lipid bilayer. The key indicates accessible and inaccessible residues and how accessibility is modified when GLUT1 is complexed with ATP (61). Trypsin cuts GLUT1 at the C-terminal side of accessible lysine (K) and arginine (R) residues. The figure also shows whether peptide directed IgGs interact with bilayer resident GLUT1 and how that interaction is modified in the presence of ATP (61).
FIGURE 4
FIGURE 4. Model for ATP regulation of GLUT1
GLUT1 experimentally-determined membrane-spanning topography (61, 62) is illustrated. The leftmost topography summarizes observations in the presence of AMP. Accessible tryptic cleavage sites (lysine or arginine residues) or sites of biotinylation (lysine residues) are shown as yellow circles (please refer to Figure 3 for specific details). Inaccessible tryptic cleavage sites (lysine or arginine residues) and inaccessible biotinylation (lysine) sites are shown as red circles. GLUT1 sequence that is inaccessible to peptide-directed antibodies is shown in red while sequence that is accessible to peptide-directed antibodies is shown in green. When ATP binds to GLUT1 (rightmost topography), a significant GLUT1 conformational change takes place rendering more sequence inaccessible to peptide-directed antibodies and making specific lysine and arginine residues less accessible to trypsin and lysine residues less accessible to biotinylating probes. This conformational change is proposed to restrict glucose release (yellow arrow) from the translocation pathway (blue arrow).
FIGURE 5
FIGURE 5. Pathways for monosaccharide metabolism in mammals
The major pathways for monosaccharide metabolism in cells and their intracellular locations are shown in schematic. The 3 compartments are cytoplasm, mitochondrion and endoplasmic reticulum (ER). Glucose (Glc), Galactose (Gal) and Fructose (Frc) enter and exit the cell on Class 1, 2 and 3 GLUTs. Lactate (produce by glycolysis) can enter or leave the cell on monocarboxylate transporters (MCTs). Galactose and glucose enter glycolysis as glucose-6-phosphate (G-6-P). Fructose enters at later steps in the glycolytic pathway as either dihydroxyacetone phosphate or glyceraldehyde-3-phosphate. Glycolysis produces 2 ATP molecules per entering glucose molecule. The Pentose phosphate pathway produces to NADPH molecules and mitochondrial oxidative phosphorylation produces 34–36 ATP molecules per glucose. Gluconeogenesis, which can be fed by pyruvate, amino acids or glycerol, produces G-6-P which is transported into the ER by a G-6-P/Pi antiporter (G6PT), dephosphorylated to Glc, which is then exported to the cytoplasm by ER GLUTs. G-6-P is converted reversibly to a useful glucose storage form (glycogen) by glycogen synthesis. Anabolic use of Glc, Gal or Frc in membrane protein and lipid glycosylation is not shown.
FIGURE 6
FIGURE 6. Glucose distribution pathways in mammals
The major distribution routes for monosaccharides and monosaccharide sensing/effector pathways are summarized schematically. The key illustrates glucose (blue arrows), fructose (pink arrows) and lactate flows (red arrows) between compartments; afferent input to the hypothalamus and brain stem (blue dashed arrows) from glucose sensors and effector output from the brain (autonomic) or pancreas (endocrine) to target organs.

References

    1. Abel ED, Kaulbach HC, Tian R, Hopkins JC, Duffy J, Doetschman T, Minnemann T, Boers ME, Hadro E, Oberste-Berghaus C, Quist W, Lowell BB, Ingwall JS, Kahn BB. Cardiac hypertrophy with preserved contractile function after selective deletion of GLUT4 from the heart. J Clin Invest. 1999;104:1703–1714. - PMC - PubMed
    1. Abel ED, Peroni O, Kim JK, Kim YB, Boss O, Hadro E, Minnemann T, Shulman GI, Kahn BB. Adipose-selective targeting of the GLUT4 gene impairs insulin action in muscle and liver. Nature. 2001;409:729–733. - PubMed
    1. Abramson J, Smirnova I, Kasho V, Verner G, Kaback HR, Iwata S. Structure and mechanism of the lactose permease of Escherichia coli. Science. 2003;301:610–615. - PubMed
    1. Accardi A, Miller C. Secondary active transport mediated by a prokaryotic homologue of ClC Cl- channels. Nature. 2004;427:803–807. - PubMed
    1. Adachi A. Electrophysiological study of hepatic vagal projection to the medulla. Neurosci Lett. 1981;24:19–23. - PubMed

Publication types

MeSH terms

LinkOut - more resources