Meta-Analysis
. 2012 Sep 3:12:385.
doi: 10.1186/1471-2407-12-385.

Systematic review with meta-analysis of the epidemiological evidence in the 1900s relating smoking to lung cancer

Affiliations
Meta-Analysis

Systematic review with meta-analysis of the epidemiological evidence in the 1900s relating smoking to lung cancer

Peter N Lee et al. BMC Cancer. .

Abstract

Background: Smoking is a known lung cancer cause, but no detailed quantitative systematic review exists. We summarize evidence for various indices.

Methods: Papers published before 2000 describing epidemiological studies involving 100+ lung cancer cases were obtained from Medline and other sources. Studies were classified as principal, or subsidiary where cases overlapped with principal studies. Data were extracted on design, exposures, histological types and confounder adjustment. RRs/ORs and 95% CIs were extracted for ever, current and ex smoking of cigarettes, pipes and cigars and indices of cigarette type and dose-response. Meta-analyses and meta-regressions investigated how relationships varied by study and RR characteristics, mainly for outcomes exactly or closely equivalent to all lung cancer, squamous cell carcinoma ("squamous") and adenocarcinoma ("adeno").

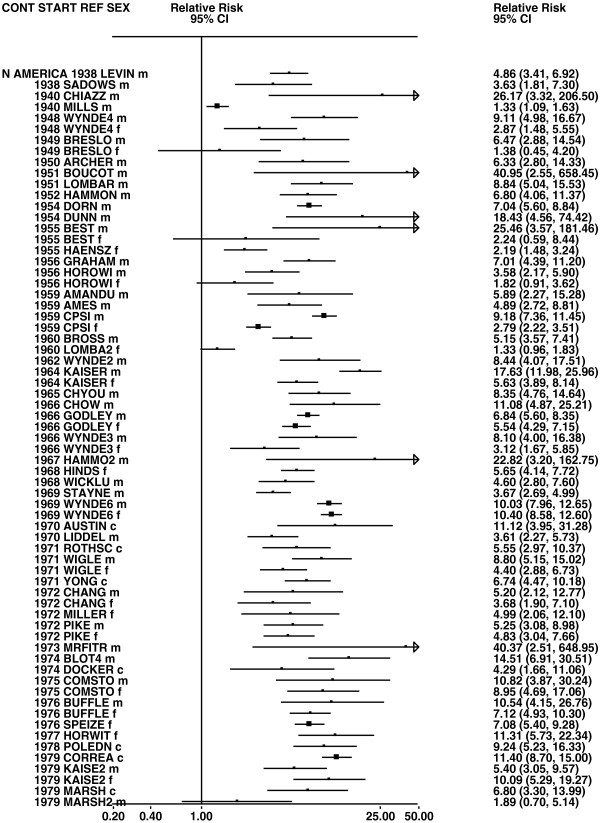
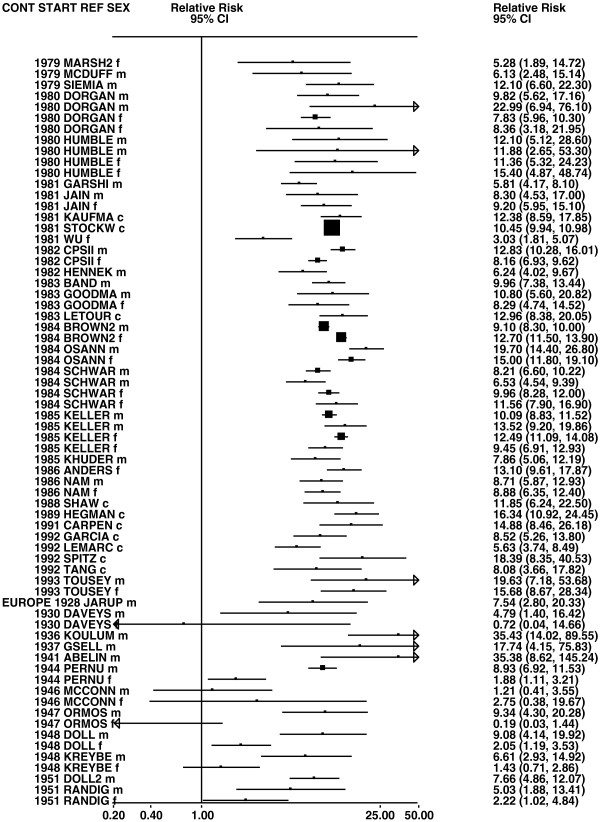
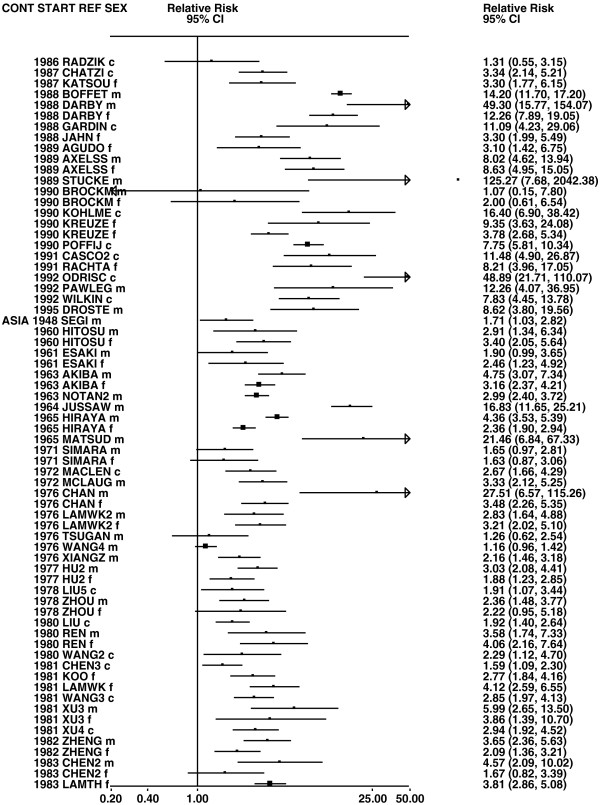
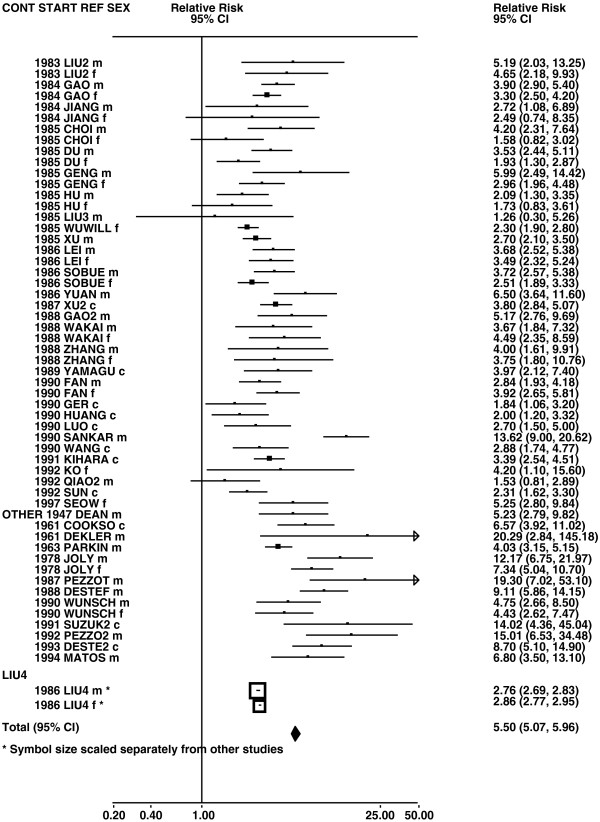
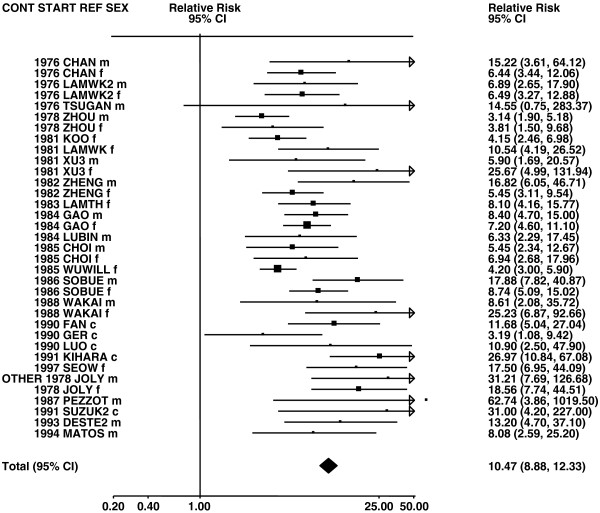
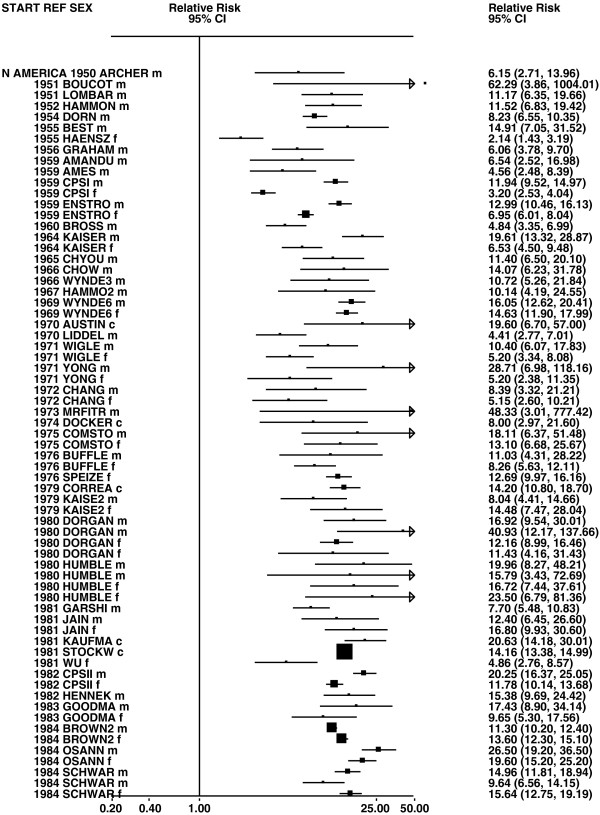
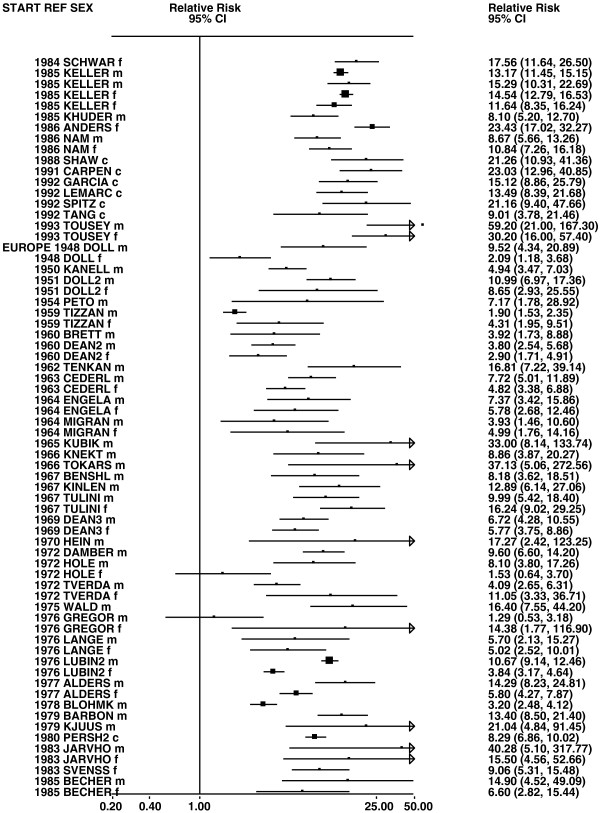
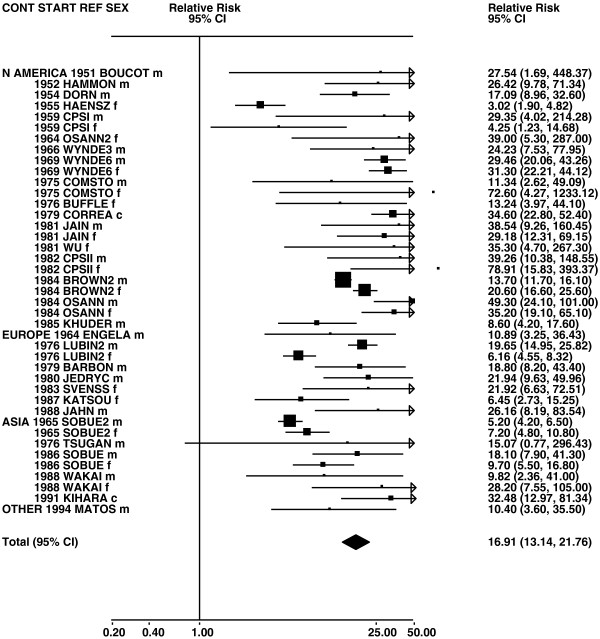
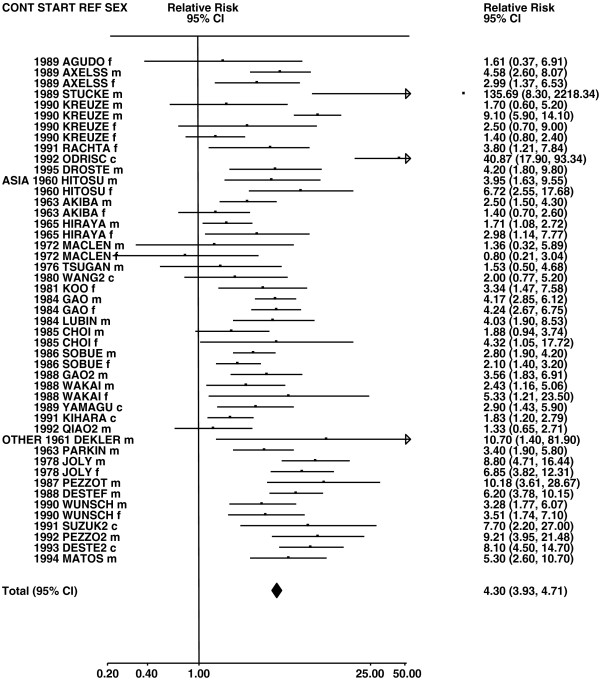
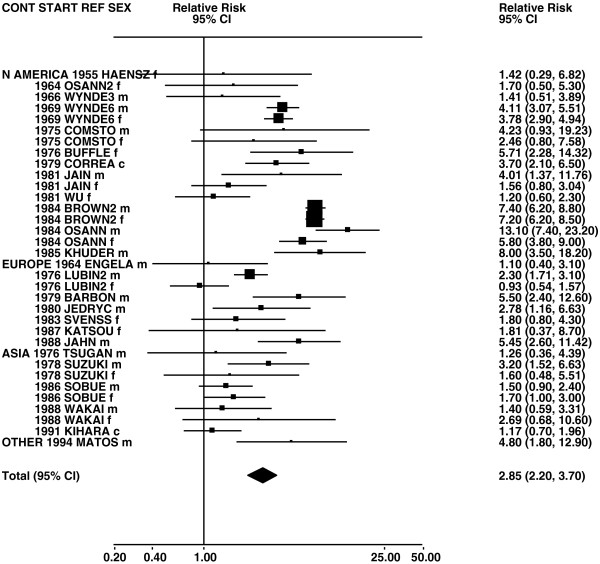
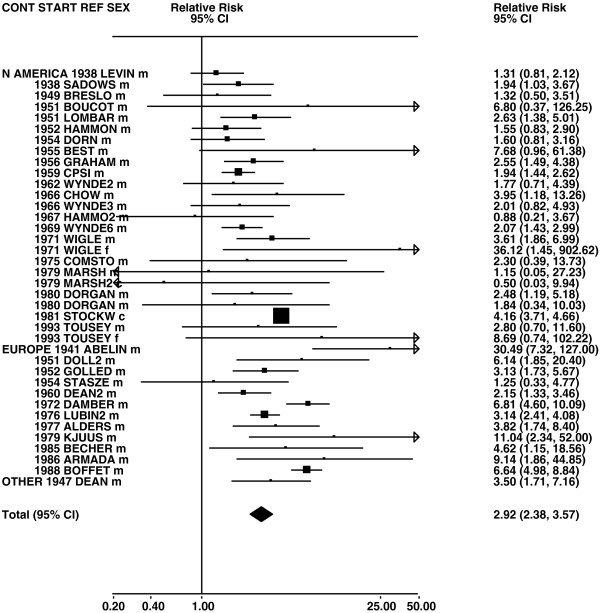
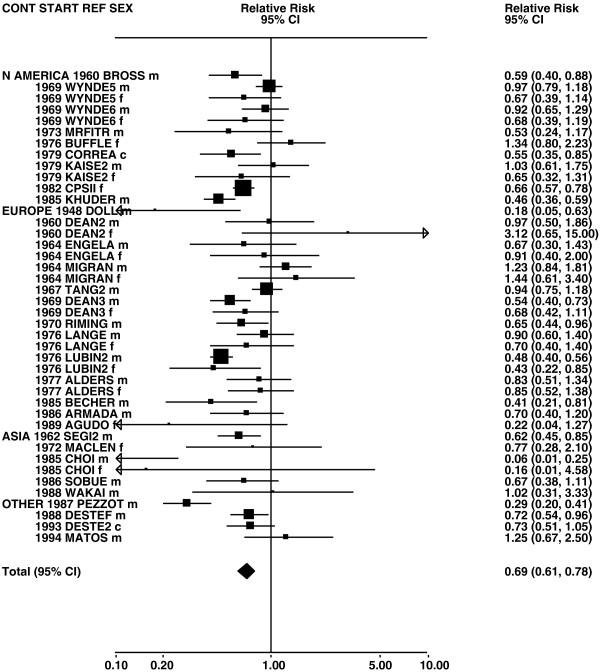
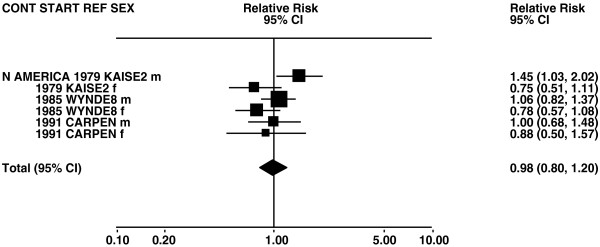
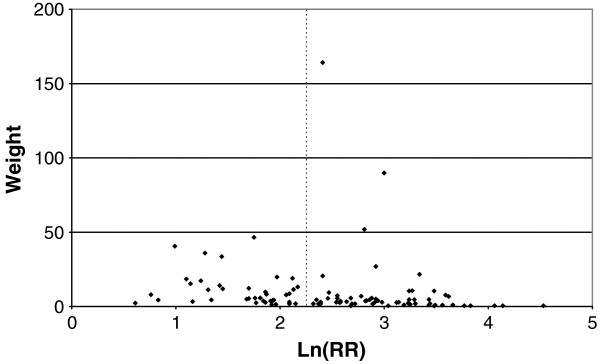
Results: 287 studies (20 subsidiary) were identified. Although RR estimates were markedly heterogeneous, the meta-analyses demonstrated a relationship of smoking with lung cancer risk, clearly seen for ever smoking (random-effects RR 5.50, CI 5.07-5.96) current smoking (8.43, 7.63-9.31), ex smoking (4.30, 3.93-4.71) and pipe/cigar only smoking (2.92, 2.38-3.57). It was stronger for squamous (current smoking RR 16.91, 13.14-21.76) than adeno (4.21, 3.32-5.34), and evident in both sexes (RRs somewhat higher in males), all continents (RRs highest for North America and lowest for Asia, particularly China), and both study types (RRs higher for prospective studies). Relationships were somewhat stronger in later starting and larger studies. RR estimates were similar in cigarette only and mixed smokers, and similar in smokers of pipes/cigars only, pipes only and cigars only. Exceptionally no increase in adeno risk was seen for pipe/cigar only smokers (0.93, 0.62-1.40). RRs were unrelated to mentholation, and higher for non-filter and handrolled cigarettes. RRs increased with amount smoked, duration, earlier starting age, tar level and fraction smoked and decreased with time quit. Relationships were strongest for small and squamous cell, intermediate for large cell and weakest for adenocarcinoma. Covariate-adjustment little affected RR estimates.

Conclusions: The association of lung cancer with smoking is strong, evident for all lung cancer types, dose-related and insensitive to covariate-adjustment. This emphasises the causal nature of the relationship. Our results quantify the relationships more precisely than previously.


Figures

Figure 1
Figure 1
Forest plot of ever smoking of any product and all lung cancer – part 1. Table 5 presents the results of a main meta-analysis for all lung cancer based on 328 relative risk (RR) and 95% confidence interval (CI) estimates for ever smoking of any product (or cigarettes if any product not available). The individual study estimates are shown numerically and graphically on a logarithmic scale in Figures 1, 2, 3, 4, 5. The studies are sorted in order of sex within study reference (REF) within start year of study (START) within continent (CONT), with the exception of study LIU4 shown at the end of Figure 5. In the graphical representation individual RRs are indicated by a solid square, with the area of the square proportional to the weight (inverse-variance of log RR). Arrows indicate where the CI extends outside the range allocated.
Figure 2
Figure 2
Forest plot of ever smoking of any product and all lung cancer – part 2. This is a continuation of Figure 1, presenting further individual study data included in the main meta-analysis for all lung cancer shown in Table 5. For study DORGAN separate estimates, within sex, are shown for whites then blacks. For study HUMBLE they are shown for non-hispanic whites then hispanics, and for study KELLER for whites then non-whites.
Figure 3
Figure 3
Forest plot of ever smoking of any product and all lung cancer – part 3. This is a continuation of Figure 2, presenting further individual study data included in the main meta-analysis for all lung cancer shown in Table 5.
Figure 4
Figure 4
Forest plot of ever smoking of any product and all lung cancer – part 4. This is a continuation of Figure 3, presenting further individual study data included in the main meta-analysis for all lung cancer shown in Table 5.
Figure 5
Figure 5
Forest plot of ever smoking of any product and all lung cancer – part 5. This is a continuation of Figure 4, presenting the remaining individual study data included in the main meta-analysis for all lung cancer shown in Table 5. Also shown are the combined random-effect estimates. These are represented by a diamond of standard height, with the width indicating the 95% CI. Note that the sizes of the squares for the two estimates from study LIU4 indicate the relative weight of the male and female data, but are not comparable with the sizes of the squares for the other estimates.
Figure 6
Figure 6
Forest plot of ever smoking of any product and squamous – part 1. Table 5 presents the results of a main meta-analysis for squamous based on 102 relative risk (RR) and 95% confidence interval (CI) estimates for ever smoking of any product (or cigarettes if any product not available). The individual study estimates are shown numerically and graphically on a logarithmic scale in Figures 6, 7. The studies are sorted in order of sex within study reference (REF) within start year of study (START) within continent (CONT). In the graphical representation individual RRs are indicated by a solid square, with the area of the square proportional to the weight (inverse-variance of log RR). Arrows indicate where the CI extends outside the range allocated. For study SCHWAR separate estimates, within sex, are shown for whites then blacks.
Figure 7
Figure 7
Forest plot of ever smoking of any product and squamous – part 2. This is a continuation of Figure 6, presenting the remaining individual study data included in the main meta-analysis for squamous shown in Table 5. Also shown are the combined random-effect estimates. These are represented by a diamond of standard height, with the width indicating the 95% CI.
Figure 8
Figure 8
Forest plot of ever smoking of any product and adeno – part 1. Table 5 presents the results of a main meta-analysis for adeno based on 107 relative risk (RR) and 95% confidence interval (CI) estimates for ever smoking of any product (or cigarettes if any product not available). The individual study estimates are shown numerically and graphically on a logarithmic scale in Figures 8, 9. The studies are sorted in order of sex within study reference (REF) within start year of study (START) within continent (CONT). In the graphical representation individual RRs are indicated by a solid square, with the area of the square proportional to the weight (inverse-variance of log RR). Arrows indicate where the CI extends outside the range allocated. For study SCHWAR separate estimates, within sex, are shown for whites then blacks.
Figure 9
Figure 9
Forest plot of ever smoking of any product and adeno – part 2. This is a continuation of Figure 8, presenting the remaining individual study data included in the main meta-analysis for adeno shown in Table 5. Also shown are the combined random-effect estimates. These are represented by a diamond of standard height, with the width indicating the 95% CI.
Figure 10
Figure 10
Forest plot of current smoking of any product and all lung cancer – part 1. Table 8 presents the results of a main meta-analysis for all lung cancer based on 195 relative risk (RR) and 95% confidence interval (CI) estimates for current smoking of any product (or cigarettes if any product not available). The individual study estimates are shown numerically and graphically on a logarithmic scale in Figures 10, 11, 12. The studies are sorted in order of sex within study reference (REF) within start year of study (START) within continent (CONT). In the graphical representation individual RRs are indicated by a solid square, with the area of the square proportional to the weight (inverse-variance of log RR). Arrows indicate where the CI extends outside the range allocated. For study DORGAN separate estimates, within sex, are shown for whites then blacks. For study HUMBLE they are shown for non-hispanic whites then hispanics, and for study SCHWAR for whites then non-whites.
Figure 11
Figure 11
Forest plot of current smoking of any product and all lung cancer – part 2. This is a continuation of Figure 10, presenting further individual study data included in the main meta-analysis for all lung cancer shown in Table 8. For study KELLER separate estimates, within sex, are shown for whites then non-whites.
Figure 12
Figure 12
Forest plot of current smoking of any product and all lung cancer – part 3. This is a continuation of Figure 11, presenting the remaining individual study data included in the main meta-analysis for all lung cancer shown in Table 8. Also shown are the combined random-effect estimates. These are represented by a diamond of standard height, with the width indicating the 95% CI. For study KREUZE separate estimates, within sex, are shown for age ≤ 45 and 55–69.
Figure 13
Figure 13
Forest plot of current smoking of any product and squamous. Table 8 presents the results of a main meta-analysis for squamous based on 41 relative risk (RR) and 95% confidence interval (CI) estimates for current smoking of any product (or cigarettes if any product not available). The individual study estimates are shown numerically and graphically on a logarithmic scale. The studies are sorted in order of sex within study reference (REF) within start year of study (START) within continent (CONT). In the graphical representation individual RRs are indicated by a solid square, with the area of the square proportional to the weight (inverse-variance of log RR). Arrows indicate where the CI extends outside the range allocated. Also shown are the combined random-effect estimates. These are represented by a diamond of standard height, with the width indicating the 95% CI.
Figure 14
Figure 14
Forest plot of current smoking of any product and adeno. Table 8 presents the results of a main meta-analysis for adeno based on 44 relative risk (RR) and 95% confidence interval (CI) estimates for current smoking of any product (or cigarettes if any product not available). The individual study estimates are shown numerically and graphically on a logarithmic scale. The studies are sorted in order of sex within study reference (REF) within start year of study (START) within continent (CONT). In the graphical representation individual RRs are indicated by a solid square, with the area of the square proportional to the weight (inverse-variance of log RR). Arrows indicate where the CI extends outside the range allocated. Also shown are the combined random-effect estimates. These are represented by a diamond of standard height, with the width indicating the 95% CI.
Figure 15
Figure 15
Forest plot of ex smoking of any product and all lung cancer – part 1. Table 12 presents the results of a main meta-analysis for all lung cancer based on 182 relative risk (RR) and 95% confidence interval (CI) estimates for ex smoking of any product (or cigarettes if any product not available). The individual study estimates are shown numerically and graphically on a logarithmic scale in Figures 15, 16, 17. The studies are sorted in order of sex within study reference (REF) within start year of study (START) within continent (CONT). In the graphical representation individual RRs are indicated by a solid square, with the area of the square proportional to the weight (inverse-variance of log RR). Arrows indicate where the CI extends outside the range allocated. For studies DORGAN and KELLER separate estimates, within sex, are shown for whites then blacks. For study HUMBLE they are shown for non-hispanic whites then Hispanics. For study KELLER the estimate shown for females is for whites.
Figure 16
Figure 16
Forest plot of ex smoking of any product and all lung cancer – part 2. This is a continuation of Figure 15, presenting further individual study data included in the main meta-analysis for all lung cancer shown in Table 12. For study KELLER the estimate shown for females is for non-whites.
Figure 17
Figure 17
Forest plot of ex smoking of any product and all lung cancer – part 3. This is a continuation of Figure 16, presenting the remaining individual study data included in the main meta-analysis for all lung cancer shown in Table 12. Also shown are the combined random-effect estimates. These are represented by a diamond of standard height, with the width indicating the 95% CI. For study KREUZE separate estimates, within sex, are shown for age ≤ 45 and 55–69.
Figure 18
Figure 18
Forest plot of ex smoking of any product and squamous. Table 12 presents the results of a main meta-analysis for squamous based on 33 relative risk (RR) and 95% confidence interval (CI) estimates for ex smoking of any product (or cigarettes if any product not available). The individual study estimates are shown numerically and graphically on a logarithmic scale. The studies are sorted in order of sex within study reference (REF) within start year of study (START) within continent (CONT). In the graphical representation individual RRs are indicated by a solid square, with the area of the square proportional to the weight (inverse-variance of log RR). Arrows indicate where the CI extends outside the range allocated. Also shown are the combined random-effect estimates. These are represented by a diamond of standard height, with the width indicating the 95% CI.
Figure 19
Figure 19
Forest plot of ex smoking of any product and adeno. Table 5 presents the results of a main meta-analysis for adeno based on 34 relative risk (RR) and 95% confidence interval (CI) estimates for ex smoking of any product (or cigarettes if any product not available). The individual study estimates are shown numerically and graphically on a logarithmic scale. The studies are sorted in order of sex within study reference (REF) within start year of study (START) within continent (CONT). In the graphical representation individual RRs are indicated by a solid square, with the area of the square proportional to the weight (inverse-variance of log RR). Arrows indicate where the CI extends outside the range allocated. Also shown are the combined random-effect estimates. These are represented by a diamond of standard height, with the width indicating the 95% CI.
Figure 20
Figure 20
Forest plot of ever pipe and/or cigar smoking and all lung cancer. Table 13 presents the results of a meta-analysis for all lung cancer based on 56 relative risk (RR) and 95% confidence interval (CI) estimates for ever pipe and/or cigar smoking. The individual study estimates are shown numerically and graphically on a logarithmic scale. The studies are sorted in order of sex within study reference (REF) within start year of study (START) within continent (CONT). In the graphical representation individual RRs are indicated by a solid square, with the area of the square proportional to the weight (inverse-variance of log RR). Arrows indicate where the CI extends outside the range allocated. Also shown are the combined random-effects estimates. These are represented by a diamond of standard height, with the width indicating the 95% CI.
Figure 21
Figure 21
Forest plot of only filter vs. only plain cigarette smoking and all lung cancer. Table 14 presents the results of a meta-analysis for all lung cancer based on 42 relative risk (RR) and 95% confidence interval (CI) estimates for only filter vs. only plain cigarette smoking. The individual study estimates are shown numerically and graphically on a logarithmic scale. The studies are sorted in order of sex within study reference (REF) within start year of study (START) within continent (CONT). In the graphical representation individual RRs are indicated by a solid square, with the area of the square proportional to the weight (inverse-variance of log RR). Arrows indicate where the CI extends outside the range allocated. Also shown are the combined random-effects estimates. These are represented by a diamond of standard height, with the width indicating the 95% CI.
Figure 22
Figure 22
Forest plot of handrolled vs. manufactured cigarette smoking and all lung cancer. Table 14 presents the results of a meta-analysis for all lung cancer based on 20 relative risk (RR) and 95% confidence interval (CI) estimates for handrolled vs. manufactured cigarette smoking. The individual study estimates are shown numerically and graphically on a logarithmic scale. The studies are sorted on sex within study reference (REF) within start year of study (START) within continent (CONT). In the graphical representation individual RRs are indicated by a solid square, with the area of the square proportional to the weight (inverse-variance of log RR). Arrows indicate where the CI extends outside the range allocated. Also shown are the combined random-effects estimates. These are represented by a diamond of standard height, with the width indicating the 95% CI.
Figure 23
Figure 23
Forest plot of mentholated vs. non-mentholated cigarette smoking of any product and all lung cancer. Table 14 presents the results of a meta-analysis for all lung cancer based on six relative risk (RR) and 95% confidence interval (CI) estimates for mentholated vs. non-mentholated cigarette smoking. The individual study estimates are shown numerically and graphically on a logarithmic scale sorted on sex within study reference (REF) within start year of study (START) within continent (CONT). The studies are sorted in order of sex within study reference (REF). In the graphical representation individual RRs are indicated by a solid square, with the area of the square proportional to the weight (inverse-variance of log RR). Arrows indicate where the CI extends outside the range allocated. Also shown are the combined random-effects estimates. These are represented by a diamond of standard height, with the width indicating the 95% CI.
Figure 24
Figure 24
Funnel plot for ever smoking and all lung cancer. Funnel plot of the 328 relative risk estimates for ever smoking and all lung cancer included in the main meta-analysis in Table 5 against their weight (inverse-variance of log RR). The dotted vertical line indicates the fixed-effect meta-analysis estimate.
Figure 25
Figure 25
Funnel plot for ever smoking and squamous. Funnel plot of the 102 relative risk estimates for ever smoking and squamous included in the main meta-analysis in Table 5 against their weight (inverse-variance of log RR). The dotted vertical line indicates the fixed-effect meta-analysis estimate.
Figure 26
Figure 26
Funnel plot for ever smoking and adeno. Funnel plot of the 107 relative risk estimates for ever smoking and adeno included in the main meta-analysis in Table 5 against their weight (inverse-variance of log RR). The dotted vertical line indicates the fixed-effect meta-analysis estimate.

References

    1. Müller FH. Tabakmißbrauch und Lungencarcinom. Z Krebsforsch. 1939;49:57–85.
    1. Wynder EL, Graham EA. Tobacco smoking as a possible etiologic factor in bronchiogenic carcinoma. A study of 684 proved cases. JAMA. 1950;143:329–336. - PubMed
    1. Doll R, Hill AB. A study of the aetiology of carcinoma of the lung. Br Med J. 1952;2:1271–1286. - PMC - PubMed
    1. Advisory Committee to the Surgeon General of the Public Health Service: Smoking and health. Report of the Advisory Committee to the Surgeon General of the Public Health Service. Washington DC: US Department of Health, Education, and Welfare; Public Health Service: Public Health Service Publication; 1964. p. 1103. http://www.surgeongeneral.gov/library/reports/index.html.
    1. US Surgeon General: Smoking and health. A report of the Surgeon General. Rockville, Maryland: US Department of Health, Education, and Welfare; Public Health Service; 1979. pp. 79–50066. http://www.surgeongeneral.gov/library/reports/index.html.