Genetic module and miRNome trait analyses reflect the distinct biological features of endothelial progenitor cells from different anatomic locations
- PMID: 22943456
- PMCID: PMC3443421
- DOI: 10.1186/1471-2164-13-447
Genetic module and miRNome trait analyses reflect the distinct biological features of endothelial progenitor cells from different anatomic locations
Abstract
Background: Endothelial progenitor cells (EPCs) play a fundamental role in post-natal vascular repair, yet EPCs from different anatomic locations possess unique biological properties. The underlying mechanisms are unclear.
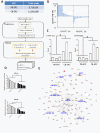
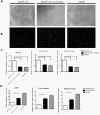
Results: EPCs from CB expressed abundant genes involved in cell cycle, hypoxia signalling and blood vessel development, correlating with the phenotypes that CB-EPCs proliferated more rapidly, migrated faster, and formed tubule structure more efficiently. smRNA-seq further deciphered miRNome patterns in EPCs isolated from CB or PB: 54 miRNAs were enriched in CB-EPCs, while another 50 in PB-EPCs. Specifically, CB-EPCs expressed more angiogenic miRNAs such as miR-31, while PB-EPCs possessed more tumor suppressive miRNAs including miR-10a. Knocking down miR-31 levels in CB-EPCs suppressed cell migration and microtubule formation, while overexpressing miR-31 in PB-EPCs helped to recapitulate some of CB-EPC functions.
Conclusions: Our results show the foundation for a more detailed understanding of EPCs from different anatomic sources. Stimulating the expression of angiogenic microRNAs or genes in EPCs of low activity (such as those from patients with cardiovascular diseases) might allow the development of novel therapeutic strategies.
Figures


Similar articles
-
miRNome traits analysis on endothelial lineage cells discloses biomarker potential circulating microRNAs which affect progenitor activities.BMC Genomics. 2014 Sep 18;15(1):802. doi: 10.1186/1471-2164-15-802. BMC Genomics. 2014. PMID: 25236949 Free PMC article.
-
MicroRNA-10A* and MicroRNA-21 modulate endothelial progenitor cell senescence via suppressing high-mobility group A2.Circ Res. 2013 Jan 4;112(1):152-64. doi: 10.1161/CIRCRESAHA.112.280016. Epub 2012 Oct 16. Circ Res. 2013. PMID: 23072816 Free PMC article.
-
Deficiency of the microRNA-31-microRNA-720 pathway in the plasma and endothelial progenitor cells from patients with coronary artery disease.Arterioscler Thromb Vasc Biol. 2014 Apr;34(4):857-69. doi: 10.1161/ATVBAHA.113.303001. Epub 2014 Feb 20. Arterioscler Thromb Vasc Biol. 2014. PMID: 24558106
-
Endothelial progenitor cells in angiogenesis.Sheng Li Xue Bao. 2005 Feb 25;57(1):1-6. Sheng Li Xue Bao. 2005. PMID: 15719128 Review.
-
Transplantation of umbilical cord blood-derived endothelial progenitor cells: a promising method of therapeutic revascularisation.Eur J Haematol. 2006 Jan;76(1):1-8. doi: 10.1111/j.1600-0609.2005.00579.x. Eur J Haematol. 2006. PMID: 16343265 Review.
Cited by
-
A role for endothelial NMDA receptors in the pathophysiology of schizophrenia.Schizophr Res. 2022 Nov;249:63-73. doi: 10.1016/j.schres.2020.10.004. Epub 2020 Nov 11. Schizophr Res. 2022. PMID: 33189520 Free PMC article. Review.
-
Endothelial progenitor cells in pregnancy-related diseases.Clin Sci (Lond). 2023 Nov 29;137(22):1699-1719. doi: 10.1042/CS20230853. Clin Sci (Lond). 2023. PMID: 37986615 Free PMC article. Review.
-
Endothelial Progenitor Cells' Classification and Application in Neurological Diseases.Tissue Eng Regen Med. 2017 Apr 3;14(4):327-332. doi: 10.1007/s13770-017-0043-4. eCollection 2017 Aug. Tissue Eng Regen Med. 2017. PMID: 30603489 Free PMC article. Review.
-
Gestational Hypoxia and Developmental Plasticity.Physiol Rev. 2018 Jul 1;98(3):1241-1334. doi: 10.1152/physrev.00043.2017. Physiol Rev. 2018. PMID: 29717932 Free PMC article. Review.
-
Comprehensive insight into endothelial progenitor cell-derived extracellular vesicles as a promising candidate for disease treatment.Stem Cell Res Ther. 2022 Jun 7;13(1):238. doi: 10.1186/s13287-022-02921-0. Stem Cell Res Ther. 2022. PMID: 35672766 Free PMC article. Review.
References
-
- Umemura T, Soga J, Hidaka T, Takemoto H, Nakamura S, Jitsuiki D, Nishioka K, Goto C, Teragawa H, Yoshizumi M. et al.Aging and hypertension are independent risk factors for reduced number of circulating endothelial progenitor cells. Am J Hypertens. 2008;21(11):1203–1209. doi: 10.1038/ajh.2008.278. - DOI - PubMed
Publication types
MeSH terms
Substances
LinkOut - more resources
Full Text Sources
Medical
Molecular Biology Databases

