

The global cost of eliminating avoidable blindness
- PMID: 22944763
- PMCID: PMC3491279
- DOI: 10.4103/0301-4738.100554
The global cost of eliminating avoidable blindness
Abstract
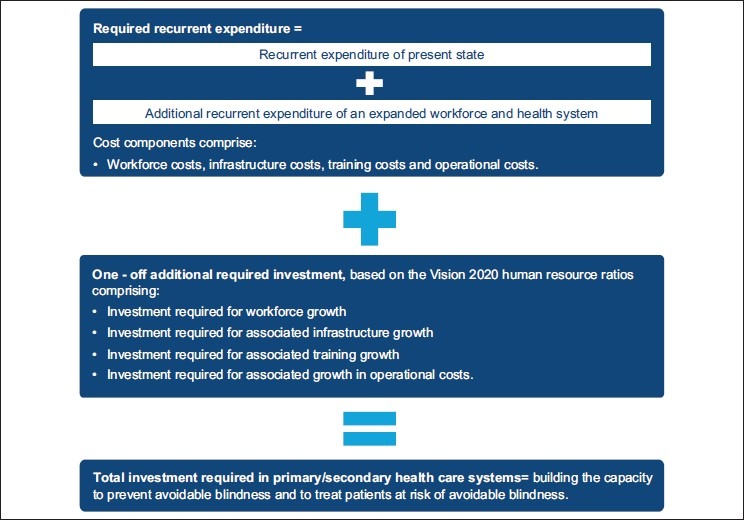
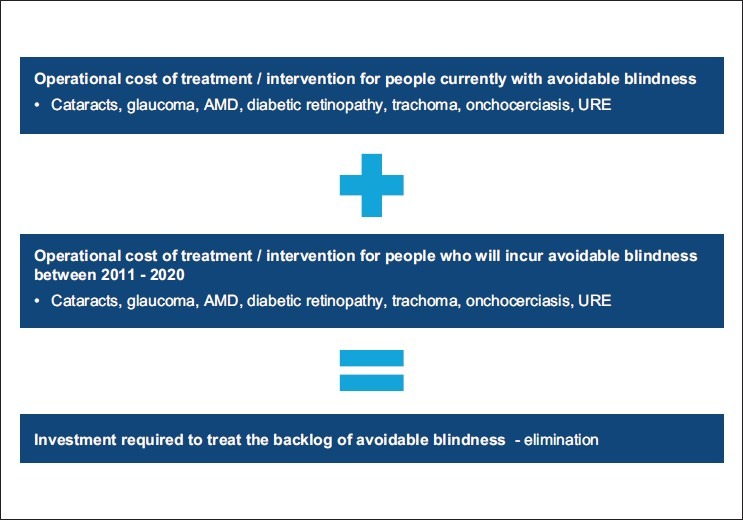
Aims: To complete an initial estimate of the global cost of eliminating avoidable blindness, including the investment required to build ongoing primary and secondary health care systems, as well as to eliminate the 'backlog' of avoidable blindness. This analysis also seeks to understand and articulate where key data limitations lie.
Materials and methods: Data were collected in line with a global estimation approach, including separate costing frameworks for the primary and secondary care sectors, and the treatment of backlog.
Results: The global direct health cost to eliminate avoidable blindness over a 10-year period from 2011 to 2020 is estimated at $632 billion per year (2009 US$). As countries already spend $592 billion per annum on eye health, this represents additional investment of $397.8 billion over 10 years, which is $40 billion per year or $5.80 per person for each year between 2010 and 2020. This is concentrated in high-income nations, which require 68% of the investment but comprise 16% of the world's inhabitants. For all other regions, the additional investment required is $127 billion.
Conclusions: This costing estimate has identified that low- and middle-income countries require less than half the additional investment compared with high-income nations. Low- and middle-income countries comprise the greater investment proportion in secondary care whereas high-income countries require the majority of investment into the primary sector. However, there is a need to improve sector data. Investment in better data will have positive flow-on effects for the eye health sector.
Conflict of interest statement
Figures
References
-
- World Health Organization: Visual Impairment and Blindness Fact Sheet 282, 2011. [Last cited 2011 June 23]. Available from: http://www.who.int/mediacentre/factsheets/fs282/e/
-
- International Agency for the Prevention of Blindness (IAPB): The Elimination of Avoidable Blindness, Reaching the Goals of VISION 2020, The Right to Sight. 2011. [Updated 2011 Apr 14; Last cited 2012 Aug 19]. Available from: http://www.worldoptometry.org .
-
- World Health Organization: Action plan for the prevention of avoidable blindness and visual impairment 2009-2013, 2010. [Last cited 2012 Jan 25]. Available from: http://www.who.int/blindness/ACTIO_PLA_WHA62-1-English.pdf .
-
- World Health Organization: Everybody's Business: Strengthening Health Systems to Improve Health Outcomes: WHO's Framework for Action 2007. [Last cited 2012 Jan 25]. Available from: http://www.who.int/healthsystems/strategy/everybodys_business.pdf .
Publication types
MeSH terms
LinkOut - more resources
Full Text Sources
Medical
Research Materials
