

Effect of nonpayment for hospital-acquired, catheter-associated urinary tract infection: a statewide analysis
- PMID: 22944872
- PMCID: PMC3652618
- DOI: 10.7326/0003-4819-157-5-201209040-00003
Effect of nonpayment for hospital-acquired, catheter-associated urinary tract infection: a statewide analysis
Abstract
Background: Most (59% to 86%) hospital-acquired urinary tract infections (UTIs) are catheter-associated urinary tract infections (CAUTIs). As of 2008, claims data are used to deny payment for certain hospital-acquired conditions, including CAUTIs, and publicly report hospital performance.
Objective: To examine rates of UTIs in adults that are coded in claims data as hospital-acquired and catheter-associated events and evaluate how often nonpayment for CAUTI lowers hospital payment.
Design: Before-and-after study of all-payer cross-sectional claims data.
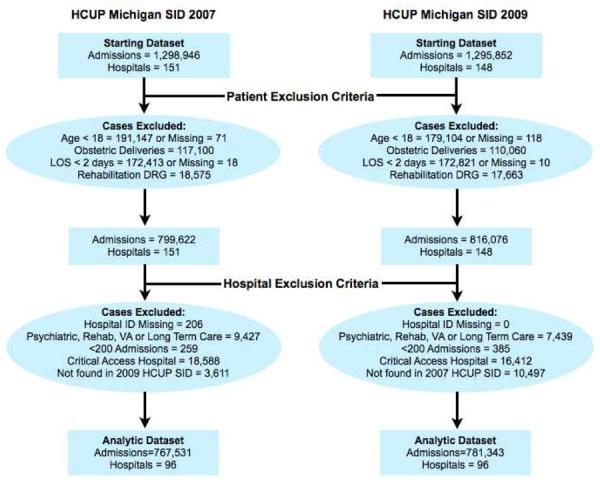
Setting: 96 nonfederal acute care Michigan hospitals.
Patients: Nonobstetric adults discharged in 2007 (n = 767 531) and 2009 (n = 781 343).
Measurements: Hospital rates of UTIs (categorized as catheter-associated or hospital-acquired) and frequency of reduced payment for hospital-acquired CAUTIs.
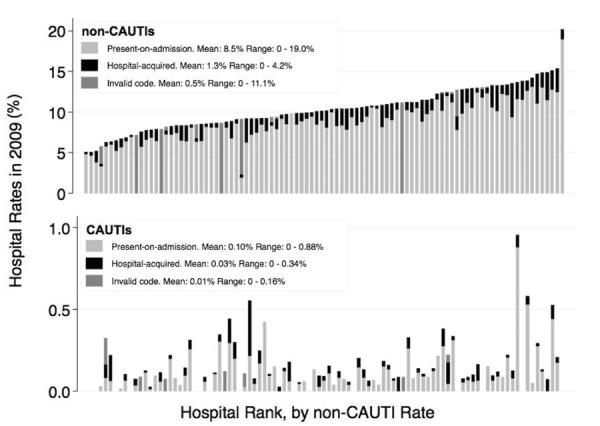
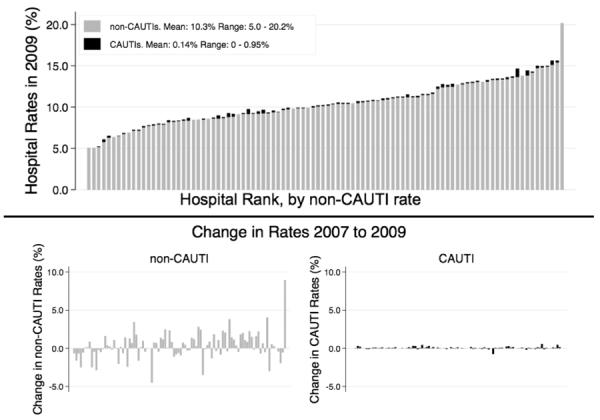
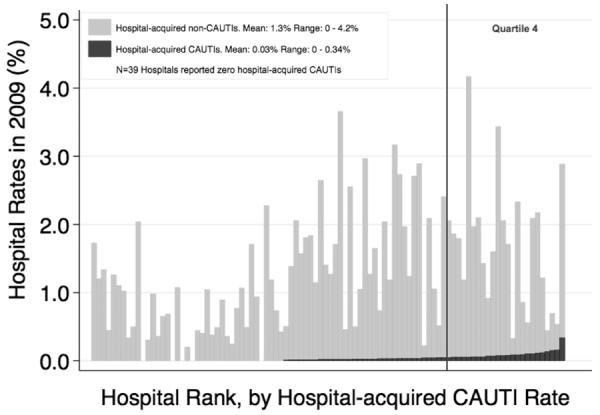
Results: Hospitals frequently requested payment for non-CAUTIs as secondary diagnoses: 10.0% (95% CI, 9.5% to 10.5%) of discharges in 2007 and 10.3% (CI, 9.8% to 10.9%) in 2009. Hospital rates of CAUTI were very low: 0.09% (CI, 0.06% to 0.12%) in 2007 and 0.14% (CI, 0.11% to 0.17%) in 2009. In 2009, 2.6% (CI, 1.6% to 3.6%) of hospital-acquired UTIs were described as CAUTIs. Nonpayment for hospital-acquired CAUTIs reduced payment for 25 of 781 343 (0.003%) hospitalizations in 2009.
Limitations: Data are from only 1 state and involved only 1 year before and after nonpayment for complications. Hospital prevention practices were not examined.
Conclusion: Catheter-associated UTI rates determined by claims data seem to be inaccurate and are much lower than expected from epidemiologic surveillance data. The financial impact of current nonpayment policy for hospital-acquired CAUTI is low. Claims data are currently not valid data sets for comparing hospital-acquired CAUTI rates for the purpose of public reporting or imposing financial incentives or penalties.
Primary funding source: Blue Cross Blue Shield of Michigan Foundation.
Figures
Comment in
-
Effect of nonpayment for hospital-acquired, catheter-associated urinary tract infection.Ann Intern Med. 2013 Feb 5;158(3):221-2. doi: 10.7326/0003-4819-158-3-201302050-00023. Ann Intern Med. 2013. PMID: 23381052 No abstract available.
-
Effect of nonpayment for hospital-acquired, catheter-associated urinary tract infection.Ann Intern Med. 2013 Feb 5;158(3):222. doi: 10.7326/0003-4819-158-3-201302050-00024. Ann Intern Med. 2013. PMID: 23381053 No abstract available.
-
Re: effect of nonpayment for preventable infections in U.S. Hospitals.J Urol. 2013 May;189(5):1738-9. doi: 10.1016/j.juro.2013.01.106. Epub 2013 Mar 7. J Urol. 2013. PMID: 23594639 No abstract available.
References
-
- Medicare program; proposed changes to the hospital inpatient prospective payment systems and fiscal year 2009 rates; proposed rules. Fed Regist. 2008;73(84):23547–62.
-
- Medicare program; changes to the hospital inpatient prospective payment systems and fiscal year 2009 rates. Fed Regist. 2008;73(161):48473–91. - PubMed
-
- Medicare program; changes to the hospital inpatient prospective payment systems and fiscal year 2008 rates. Fed Regist. 2007;72(162):47129–8175. - PubMed
-
- Chan S, Halim S, Rupp M, Wrobel M. CMS's experience in Publicly Reporting Hospital Acquired Conditions. AcademyHealth; Seattle, WA: Jun 12, 2011.
-
- Medicare program; changes to the hospital inpatient prospective payment systems and fiscal year 2008 rates. Fed Regist. 2007;72(162):47129–8175. - PubMed
Publication types
MeSH terms
Grants and funding
LinkOut - more resources
Full Text Sources
Medical
Research Materials