

U.S. trends in antiretroviral therapy use, HIV RNA plasma viral loads, and CD4 T-lymphocyte cell counts among HIV-infected persons, 2000 to 2008
- PMID: 22944874
- PMCID: PMC3534765
- DOI: 10.7326/0003-4819-157-5-201209040-00005
U.S. trends in antiretroviral therapy use, HIV RNA plasma viral loads, and CD4 T-lymphocyte cell counts among HIV-infected persons, 2000 to 2008
Abstract
Background: The U.S. National HIV/AIDS Strategy targets for 2015 include "increasing access to care and improving health outcomes for persons living with HIV in the United States" (PLWH-US).
Objective: To demonstrate the utility of the NA-ACCORD (North American AIDS Cohort Collaboration on Research and Design) for monitoring trends in the HIV epidemic in the United States and to present trends in HIV treatment and related health outcomes.
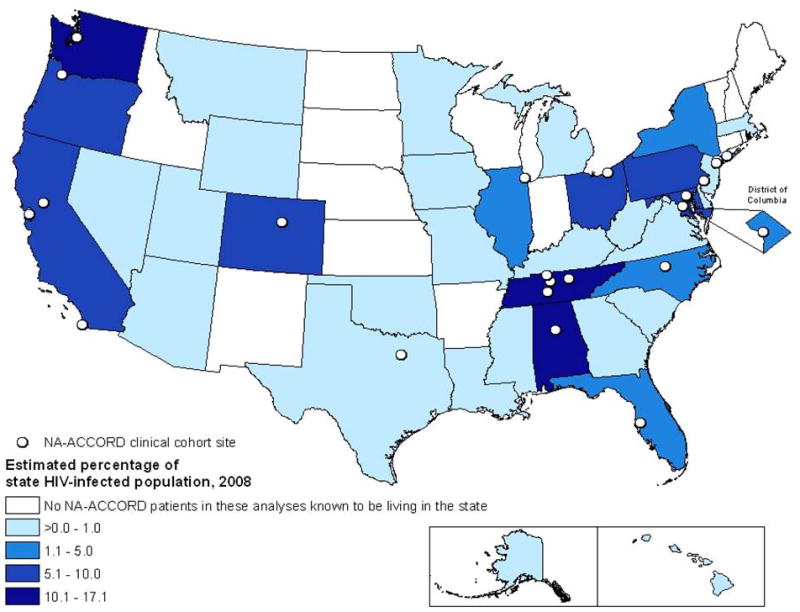
Design: Trends from annual cross-sectional analyses comparing patients from pooled, multicenter, prospective, clinical HIV cohort studies with PLWH-US, as reported to national surveillance systems in 40 states.
Setting: U.S. HIV outpatient clinics.
Patients: HIV-infected adults with 1 or more HIV RNA plasma viral load (HIV VL) or CD4 T-lymphocyte (CD4) cell count measured in any calendar year from 1 January 2000 to 31 December 2008.
Measurements: Annual rates of antiretroviral therapy use, HIV VL, and CD4 cell count at death.
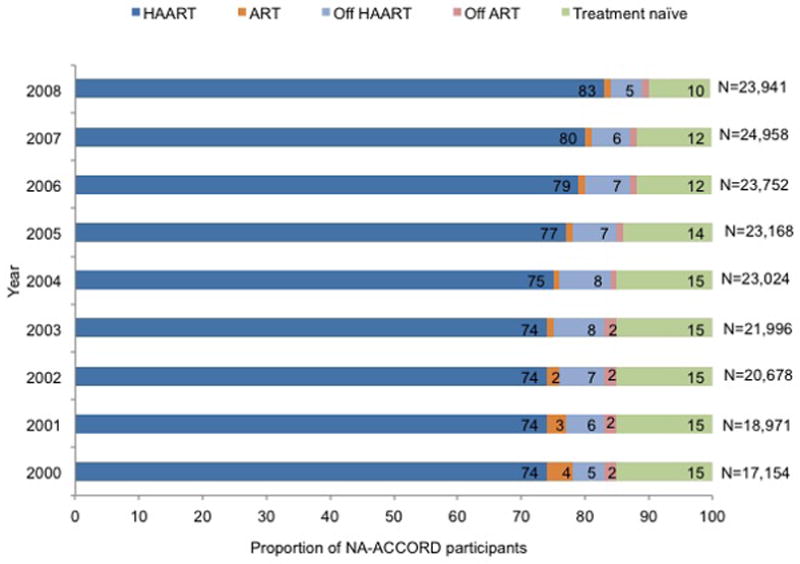
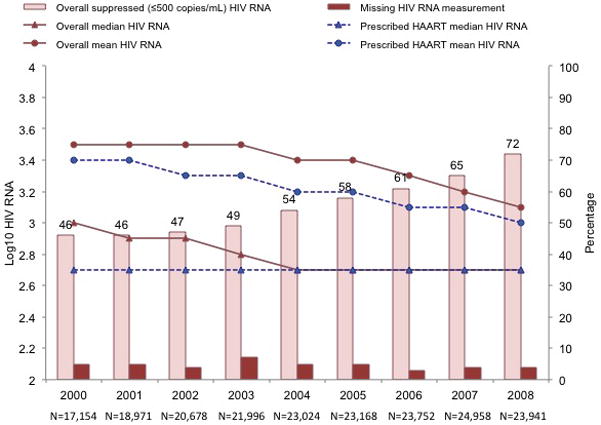
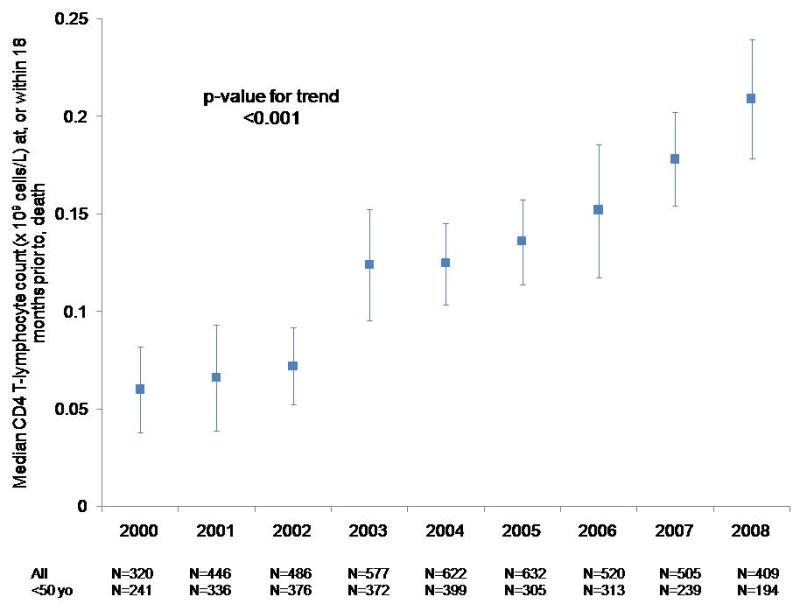
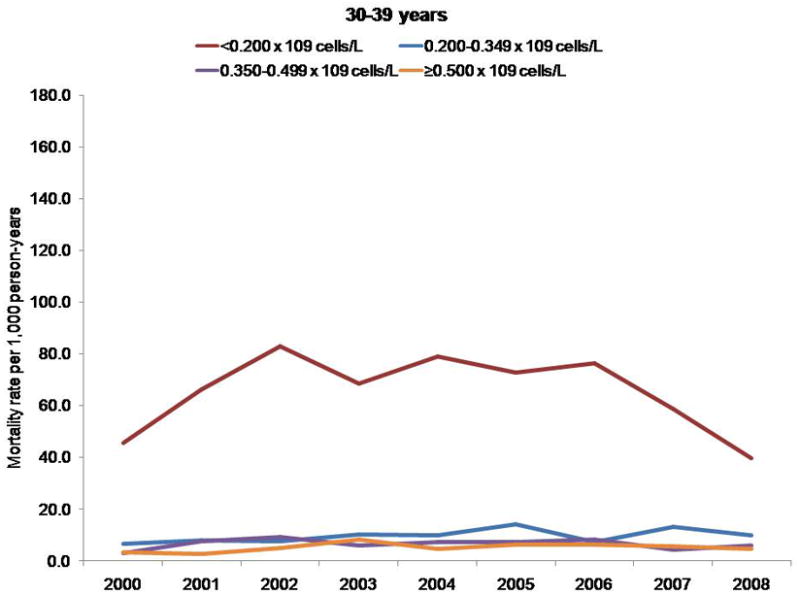
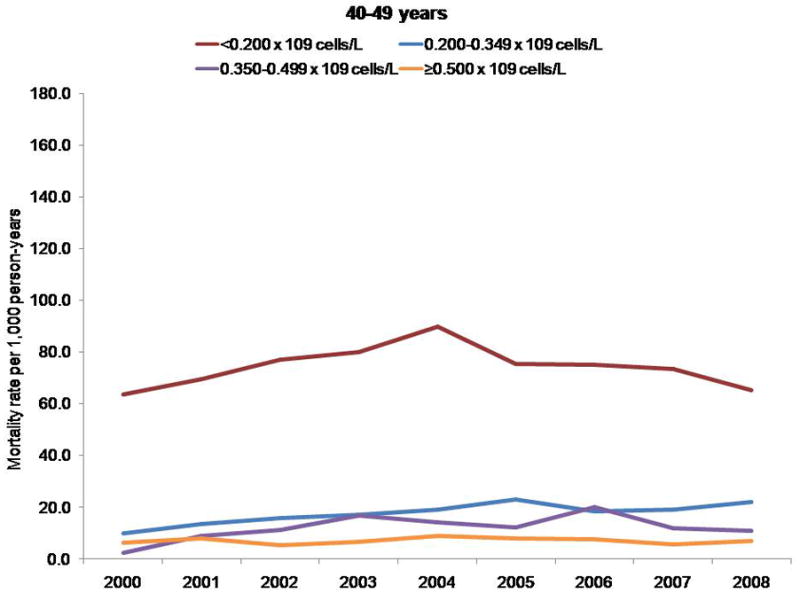
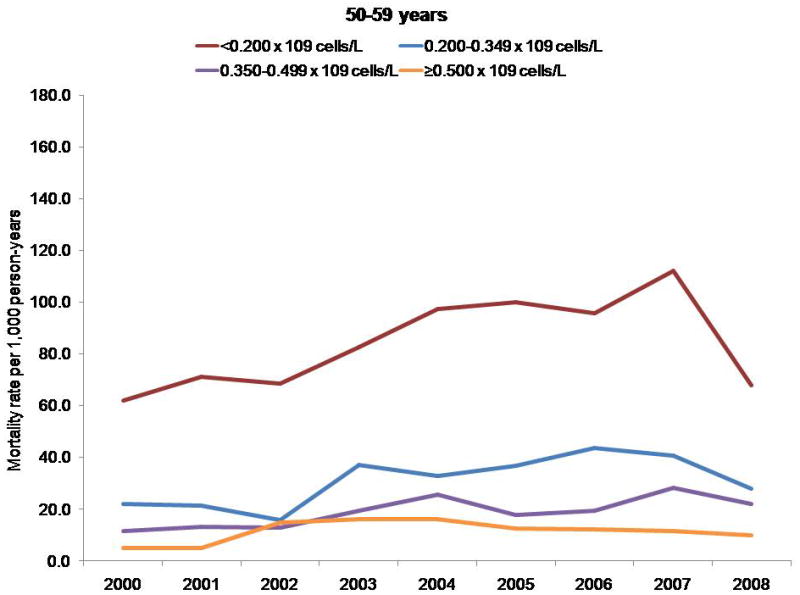
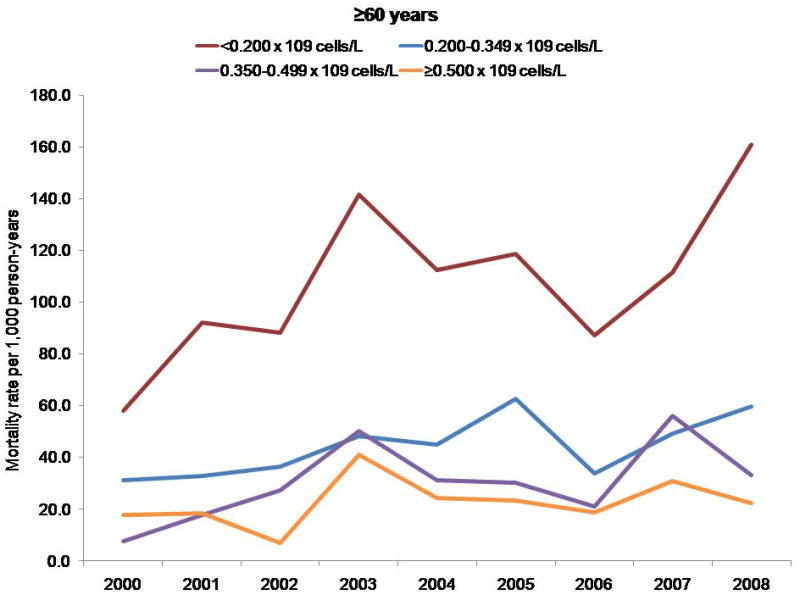
Results: 45 529 HIV-infected persons received care in an NA-ACCORD-participating U.S. clinical cohort from 2000 to 2008. In 2008, the 26 030 NA-ACCORD participants in care and the 655 966 PLWH-US had qualitatively similar demographic characteristics. From 2000 to 2008, the proportion of participants prescribed highly active antiretroviral therapy increased by 9 percentage points to 83% (P < 0.001), whereas the proportion with suppressed HIV VL (≤2.7 log10 copies/mL) increased by 26 percentage points to 72% (P < 0.001). Median CD4 cell count at death more than tripled to 0.209 × 10⁹ cells/L (P < 0.001).
Limitation: The usual limitations of observational data apply.
Conclusion: The NA-ACCORD is the largest cohort of HIV-infected adults in clinical care in the United States that is demographically similar to PLWH-US in 2008. From 2000 to 2008, increases were observed in the percentage of prescribed HAART, the percentage who achieved a suppressed HIV VL, and the median CD4 cell count at death.
Primary funding source: National Institutes of Health; Centers for Disease Control and Prevention; Canadian Institutes of Health Research; Canadian HIV Trials Network; and the government of British Columbia, Canada.
Conflict of interest statement
Potential Conflicts of Interest: Disclosures can be viewed at
Figures
References
-
- Palella FJ, Jr, Delaney KM, Moorman AC, Loveless MO, Fuhrer J, Satten GA, et al. Declining morbidity and mortality among patients with advanced human immunodeficiency virus infection. HIV Outpatient Study Investigators. N Engl J Med. 1998;338:853–60. - PubMed
-
- Centers for Disease Control and Prevention (CDC) HIV surveillance---United States, 1981–2008. MMWR Morb Mortal Wkly Rep. 2011;60:689–93. - PubMed
-
- White House Office of National AIDS Policy. National HIV/AIDS Strategy for the United States. Washington, DC: White House Office of National AIDS Policy; 2010. [Accessed at on 3 July 2012.]. www.aids.gov/federal-resources/policies/national-hiv-aids-strategy/nhas.pdf.
Publication types
MeSH terms
Substances
Grants and funding
- K24 DA000432/DA/NIDA NIH HHS/United States
- U01 AI038855/AI/NIAID NIH HHS/United States
- P30-AI50410/AI/NIAID NIH HHS/United States
- P30-AI27757/AI/NIAID NIH HHS/United States
- R01 AA016893/AA/NIAAA NIH HHS/United States
- U01-AI34989/AI/NIAID NIH HHS/United States
- P30 AI027767/AI/NIAID NIH HHS/United States
- U01 AI035042/AI/NIAID NIH HHS/United States
- F31 DA030254/DA/NIDA NIH HHS/United States
- U01-AI38855/AI/NIAID NIH HHS/United States
- CBR-86906/CAPMC/ CIHR/Canada
- R01-AA16893/AA/NIAAA NIH HHS/United States
- U01 AI069434/AI/NIAID NIH HHS/United States
- M01 RR000079/RR/NCRR NIH HHS/United States
- R24-AI067039/AI/NIAID NIH HHS/United States
- U01 AI037984/AI/NIAID NIH HHS/United States
- U01-HD32632/HD/NICHD NIH HHS/United States
- R01 DA011602/DA/NIDA NIH HHS/United States
- K23 EY013707/EY/NEI NIH HHS/United States
- K01 AI071725/AI/NIAID NIH HHS/United States
- P30-AI27763/AI/NIAID NIH HHS/United States
- U01-AI34993/AI/NIAID NIH HHS/United States
- K23-EY013707/EY/NEI NIH HHS/United States
- U01-AI35043/AI/NIAID NIH HHS/United States
- Z01 CP010176/ImNIH/Intramural NIH HHS/United States
- AI-69432/AI/NIAID NIH HHS/United States
- M01-RR00083/RR/NCRR NIH HHS/United States
- TGF-96118/CAPMC/ CIHR/Canada
- U01 AI031834/AI/NIAID NIH HHS/United States
- HCP-97105/CAPMC/ CIHR/Canada
- P30 AI094189/AI/NIAID NIH HHS/United States
- U01-AI38858/AI/NIAID NIH HHS/United States
- UM1 AI069434/AI/NIAID NIH HHS/United States
- M01-RR00079/RR/NCRR NIH HHS/United States
- U01 AI035004/AI/NIAID NIH HHS/United States
- UM1 AI069432/AI/NIAID NIH HHS/United States
- P30 AI054999/AI/NIAID NIH HHS/United States
- R01-DA04334/DA/NIDA NIH HHS/United States
- U01-AI35040/AI/NIAID NIH HHS/United States
- R01 DA004334/DA/NIDA NIH HHS/United States
- U01-AI37984/AI/NIAID NIH HHS/United States
- M01-RR00071/RR/NCRR NIH HHS/United States
- U10-EY08052/EY/NEI NIH HHS/United States
- U01-AI35004/AI/NIAID NIH HHS/United States
- AI-69434/AI/NIAID NIH HHS/United States
- U10-AA13566/AA/NIAAA NIH HHS/United States
- CDC200-2006-18797/PHS HHS/United States
- U01-AI68636/AI/NIAID NIH HHS/United States
- UL1 RR024131/RR/NCRR NIH HHS/United States
- U01 AI034989/AI/NIAID NIH HHS/United States
- U01-AI68634/AI/NIAID NIH HHS/United States
- U01 AI037613/AI/NIAID NIH HHS/United States
- KRS-86251/CAPMC/ CIHR/Canada
- M01 RR000071/RR/NCRR NIH HHS/United States
- AHQ290-01-0012/PHS HHS/United States
- U01-AI35042/AI/NIAID NIH HHS/United States
- M01 RR000722/RR/NCRR NIH HHS/United States
- M01-RR025747/RR/NCRR NIH HHS/United States
- CBR-94036/CAPMC/ CIHR/Canada
- U01 AI035041/AI/NIAID NIH HHS/United States
- R24 AI067039/AI/NIAID NIH HHS/United States
- U01-AI37613/AI/NIAID NIH HHS/United States
- M01-RR-00052/RR/NCRR NIH HHS/United States
- U01-AI069918/AI/NIAID NIH HHS/United States
- U01 AI069432/AI/NIAID NIH HHS/United States
- U01-AI42590/AI/NIAID NIH HHS/United States
- U01 AI038858/AI/NIAID NIH HHS/United States
- U10 AA013566/AA/NIAAA NIH HHS/United States
- R01-DA12568/DA/NIDA NIH HHS/United States
- U10 EY008057/EY/NEI NIH HHS/United States
- UL1-RR024131/RR/NCRR NIH HHS/United States
- U01 AI068636/AI/NIAID NIH HHS/United States
- U01-AI31834/AI/NIAID NIH HHS/United States
- U01 AI034994/AI/NIAID NIH HHS/United States
- M01 RR000052/RR/NCRR NIH HHS/United States
- K24-DA00432/DA/NIDA NIH HHS/United States
- U10 EY008052/EY/NEI NIH HHS/United States
- R21 AA015032/AA/NIAAA NIH HHS/United States
- P30 AI027763/AI/NIAID NIH HHS/United States
- K01 AI093197/AI/NIAID NIH HHS/United States
- U01 AI069918/AI/NIAID NIH HHS/United States
- U01-AI35041/AI/NIAID NIH HHS/United States
- N02 CP055504/CP/NCI NIH HHS/United States
- U01 AI035043/AI/NIAID NIH HHS/United States
- K23-AI610320/AI/NIAID NIH HHS/United States
- P30 AI027757/AI/NIAID NIH HHS/United States
- UL1 RR025747/RR/NCRR NIH HHS/United States
- U01-AI35039/AI/NIAID NIH HHS/United States
- R01 DA012568/DA/NIDA NIH HHS/United States
- U10-EY08067/EY/NEI NIH HHS/United States
- F31-DA30254/DA/NIDA NIH HHS/United States
- P30-AI27767/AI/NIAID NIH HHS/United States
- U01 AI035040/AI/NIAID NIH HHS/United States
- K01-AI093197/AI/NIAID NIH HHS/United States
- U01 AI034993/AI/NIAID NIH HHS/United States
- R01-DA11602/DA/NIDA NIH HHS/United States
- M01 RR000083/RR/NCRR NIH HHS/United States
- K01-AI071725/AI/NIAID NIH HHS/United States
- U01-AI34994/AI/NIAID NIH HHS/United States
- 169621/CAPMC/ CIHR/Canada
- U01 AI035039/AI/NIAID NIH HHS/United States
- U10-EY08057/EY/NEI NIH HHS/United States
- U10 EY008067/EY/NEI NIH HHS/United States
- U01 AI068634/AI/NIAID NIH HHS/United States
- P30 AI050410/AI/NIAID NIH HHS/United States
- U01 HD032632/HD/NICHD NIH HHS/United States
- U01 AI042590/AI/NIAID NIH HHS/United States
- P30-AI54999/AI/NIAID NIH HHS/United States
LinkOut - more resources
Full Text Sources
Medical
Research Materials