

Prevalence of esophageal atresia among 18 international birth defects surveillance programs
- PMID: 22945024
- PMCID: PMC4467200
- DOI: 10.1002/bdra.23067
Prevalence of esophageal atresia among 18 international birth defects surveillance programs
Abstract
Background: The prevalence of esophageal atresia (EA) has been shown to vary across different geographical settings. Investigation of geographical differences may provide an insight into the underlying etiology of EA.
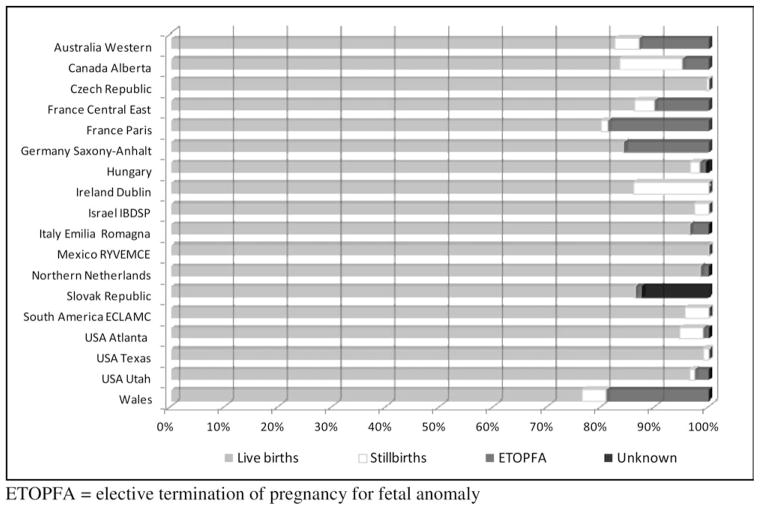
Methods: The study population comprised infants diagnosed with EA during 1998 to 2007 from 18 of the 46 birth defects surveillance programs, members of the International Clearinghouse for Birth Defects Surveillance and Research. Total prevalence per 10,000 births for EA was defined as the total number of cases in live births, stillbirths, and elective termination of pregnancy for fetal anomaly (ETOPFA) divided by the total number of all births in the population.
Results: Among the participating programs, a total of 2943 cases of EA were diagnosed with an average prevalence of 2.44 (95% confidence interval [CI], 2.35-2.53) per 10,000 births, ranging between 1.77 and 3.68 per 10,000 births. Of all infants diagnosed with EA, 2761 (93.8%) were live births, 82 (2.8%) stillbirths, 89 (3.0%) ETOPFA, and 11 (0.4%) had unknown outcomes. The majority of cases (2020, 68.6%), had a reported EA with fistula, 749 (25.5%) were without fistula, and 174 (5.9%) were registered with an unspecified code.
Conclusions: On average, EA affected 1 in 4099 births (95% CI, 1 in 3954-4251 births) with prevalence varying across different geographical settings, but relatively consistent over time and comparable between surveillance programs. Findings suggest that differences in the prevalence observed among programs are likely to be attributable to variability in population ethnic compositions or issues in reporting or registration procedures of EA, rather than a real risk occurrence difference. Birth Defects Research (Part A), 2012.
Copyright © 2012 Wiley Periodicals, Inc.
Figures
References
-
- Bower C, Rudy E, Callaghan A, et al. Report of the Birth Defects Registry Of Western Australia, 1980–2008. Perth: King Edward Memorial Hospital; 2009. [Accessed August 9, 2012]. Available at: http://kemh.health.wa.gov.au/services/register_developmental_anomalies/d....
-
- Canfield MA, Ramadhani TA, Yuskiv N, et al. Improved national prevalence estimates for 18 selected major birth defects–United States, 1999–2001. MMWR Morb Mortal Wkly Rep. 2006;54:1301–1305. - PubMed
-
- Carmichael SL, Shaw GM, Kaidarova Z, et al. Congenital malformations in offspring of Hispanic and African-American women in California, 1989–1997. Birth Defects Res A Clin Mol Teratol. 2004;70:382–388. - PubMed
-
- Castilla EE, Orioli IM. ECLAMC: the Latin-American collaborative study of congenital malformations. Community Genet. 2004;7:76–94. - PubMed
-
- Choudhry M, Boyd PA, Chamberlain PF, et al. Prenatal diagnosis of tracheo-oesophageal fistula and oesophageal atresia. Prenat Diagn. 2007;27:608–610. - PubMed
Publication types
MeSH terms
Grants and funding
LinkOut - more resources
Full Text Sources
