. 2013 Oct;35(5):1607-20.
doi: 10.1007/s11357-012-9465-z. Epub 2012 Sep 4.

Age- and calorie restriction-related changes in rat brain mitochondrial DNA and TFAM binding

Affiliations

Age- and calorie restriction-related changes in rat brain mitochondrial DNA and TFAM binding

Anna Picca et al. Age (Dordr). 2013 Oct.

Abstract

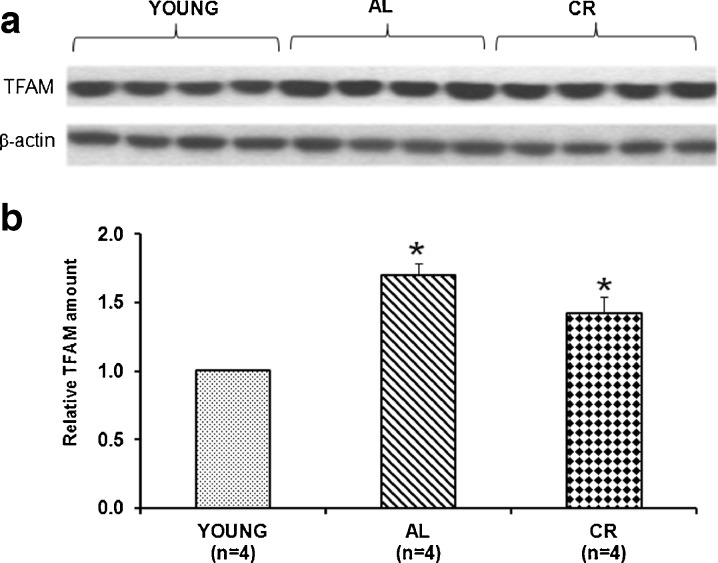
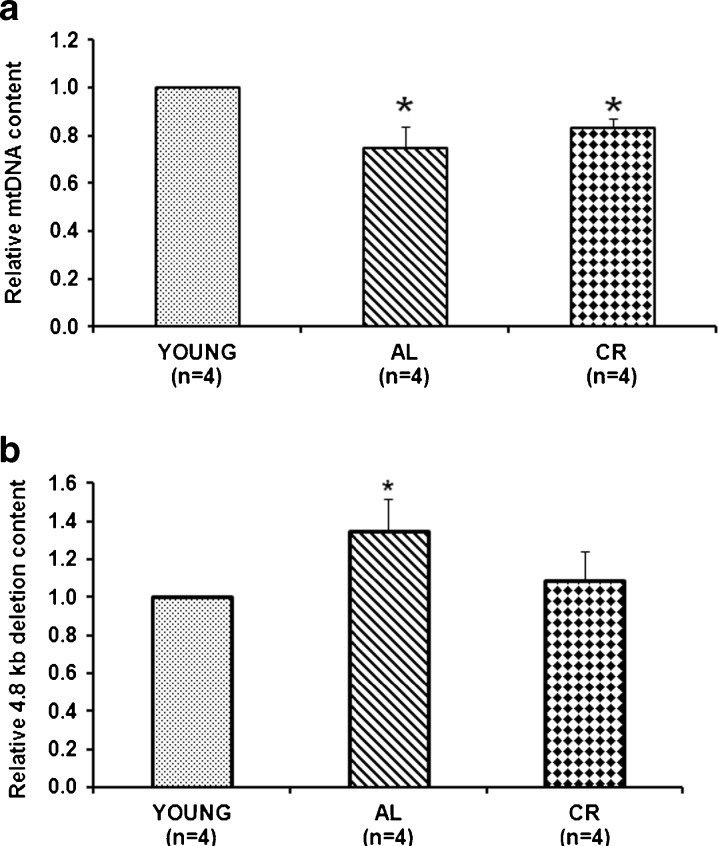
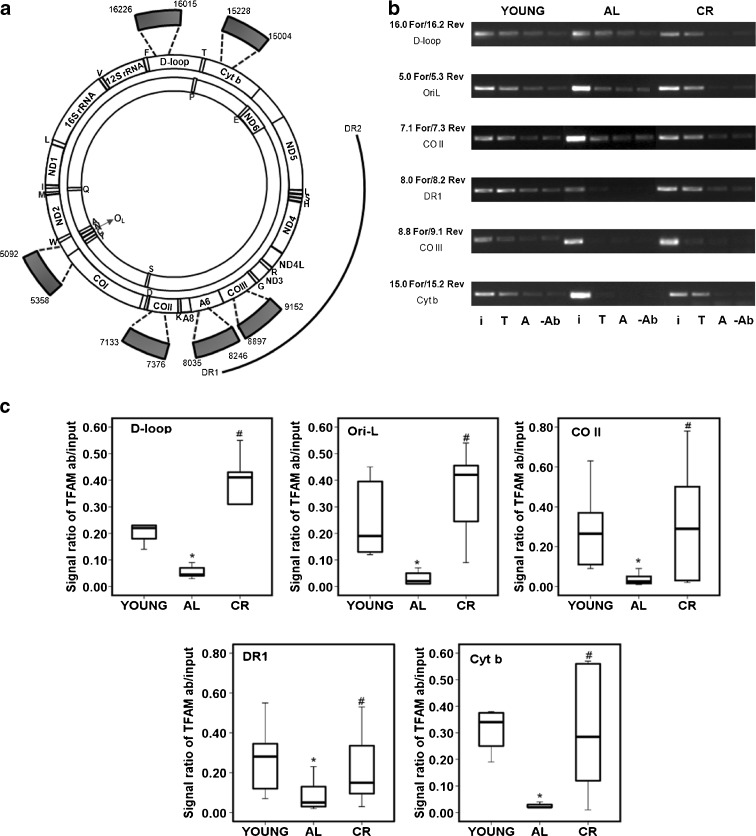
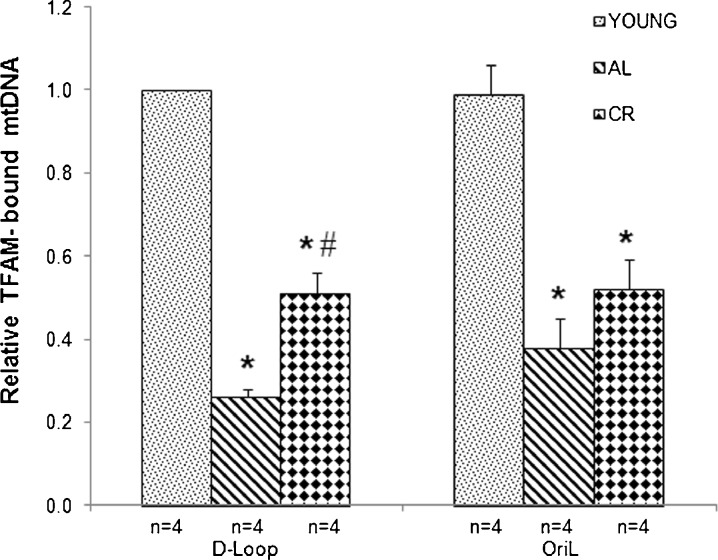
Aging markedly affects mitochondrial biogenesis and functions particularly in tissues highly dependent on the organelle's bioenergetics capability such as the brain's frontal cortex. Calorie restriction (CR) diet is, so far, the only intervention able to delay or prevent the onset of several age-related alterations in different organisms. We determined the contents of mitochondrial transcription factor A (TFAM), mitochondrial DNA (mtDNA), and the 4.8-kb mtDNA deletion in the frontal cortex from young (6-month-old) and aged (26-month-old), ad libitum-fed (AL) and calorie-restricted (CR), rats. We found a 70 % increase in TFAM amount, a 25 % loss in mtDNA content, and a 35 % increase in the 4.8-kb deletion content in the aged AL animals with respect to the young rats. TFAM-specific binding to six mtDNA regions was analyzed by mtDNA immunoprecipitation and semiquantitative polymerase chain reaction (PCR), showing a marked age-related decrease. Quantitative real-time PCR at two subregions involved in mtDNA replication demonstrated, in aged AL rats, a remarkable decrease (60-70 %) of TFAM-bound mtDNA. The decreased TFAM binding is a novel finding that may explain the mtDNA loss in spite of the compensatory TFAM increased amount. In aged CR rats, TFAM amount increased and mtDNA content decreased with respect to young rats' values, but the extent of the changes was smaller than in aged AL rats. Attenuation of the age-related effects due to the diet in the CR animals was further evidenced by the unchanged content of the 4.8-kb deletion with respect to that of young animals and by the partial prevention of the age-related decrease in TFAM binding to mtDNA.


Figures

Fig. 1
Fig. 1
Age- and CR-related changes of TFAM amount in the rat frontal cortex. a Representative western blot carried out in the assayed samples. The bands from top to bottom show, respectively, the signals from TFAM and β-actin. b The histogram shows the relative amount of TFAM in AL and CR rats, compared to young rats, all normalized with respect to β-actin. Bars represent the mean (±SD) of the values obtained, respectively, from analysis in triplicate of the protein extract, from each young and aged AL and CR-treated rat. *p < 0.05 versus the value of the young rats (fixed as 1); n number of analyzed animals
Fig. 2
Fig. 2
Age- and CR-related changes of the relative mtDNA content and of the 4.8-kb deletion content. a The histogram shows the mean value of the ratio mtDNA/nuclear DNA in AL and CR rats, compared to young rats. Bars represent the mean (±SD) obtained, respectively, from analysis in triplicate of total nucleic acids from each young and aged AL and CR-treated rat. *p < 0.05 versus the value of the young rats (fixed as 1); n number of analyzed animals. b The histogram shows the mean value of the ratio deleted mtDNA/total mtDNA in AL and CR rats, compared to young animals. Bars represent the mean (±SD) of the values obtained, respectively, from analysis in triplicate of the total nucleic acids from each young and aged AL and CR-treated rat. *p < 0.05 versus the value of the young rats (fixed as 1); n number of analyzed animals
Fig. 3
Fig. 3
Age- and CR-related changes of TFAM binding to rat mtDNA regions by mIP assay. a Rat mtDNA consists of a heavy-strand (outer circle) and a light-strand (inner circle) that code for the 12S and 16S rRNAs and 22 tRNAs genes (single-letter codes indicated under the corresponding tRNA genes) and subunits of the oxidative phosphorylation complexes: NADH dehydrogenase subunits (ND1–6 and ND4L), cytochrome b (Cyt b), cytochrome c oxidase subunits (CO I–III), and ATP synthase subunits (A6, A8). The thick arches extending out of the circles represent the six mIP amplified regions delimited, respectively, by the primer pairs: 16.0 For/16.2 Rev (D-loop), 5.0 For/5.3 Rev (OriL), 7.1 For/7.3 Rev (CO II), 8.0 For/8.2 Rev (DR1), 8.8 For/9.1 Rev (CO III), and 15.0 For/15.2 Rev (Cyt b), listed in Table 1, and corresponding to the indicated nucleotides. Numbering is according to GenBank™ accession number AY172581. The outmost arch represents the 4.8-kb deletion, delimited by direct repeat 1 (DR1) and direct repeat 2 (DR2). b Semiquantitative PCR of mIP assay. Representative results of PCR amplifications of the mIP-derived templates from a young rat, an AL aged rat, and a CR aged rat for the indicated regions. The specific primer pairs and the amplified genetic region are indicated on the left side of the gel. The PCRs contained either input DNA (i) or mIP mtDNA immunoprecipitated with TFAM (T) or mIP mtDNA immunoprecipitated with β-actin (A) or mIP mtDNA immunoprecipitated with no antibody (−Ab). c Quantitative evaluation of TFAM binding results in the three groups of animals after the mIP assay performed at five mtDNA regions (the results for the CO III region were not evaluated due to the very reduced TFAM binding at this region in all groups of animals). The groups of assayed animals included, respectively, six young, six AL, and six CR rats and their values were represented in the box-plot format. The box contains the middle 50 % of the data (with the upper edge and the lower edge representing the 75th and 25th percentiles, respectively); the horizontal line within the box represents the median value. The filled lines indicate the minimum and maximum data values for each rat group, unless data points extend further than 1.5 times the interquartile range, in which case these values are represented as individual points
Fig. 4
Fig. 4
Age- and CR-related changes of the relative mtDNA amount bound by TFAM in two mtDNA regions determined by RT-PCR. The amplified products enclose sections, respectively, of the D-loop region and of the OriL region delimited by the primer pairs listed in the bottom part of Table 1. The calculation of the amount of TFAM-bound mtDNA was performed according to the formula formula image, where formula image is the difference between the CT values of the input and of the immunoprecipitated sample and formula image is the CT difference between the CT values of the input and of the no-antibody sample. The obtained results were then normalized with respect to the mean value of TFAM-bound mtDNA in the D-loop region from young animals. Bars represent the mean (±SD) of the relative amounts of TFAM-bound mtDNA derived from each of the assayed animals in the specific group. *p < 0.05 versus the value of the young rats (fixed as 1); #p < 0.05 versus the amount from the same region of aged AL rats; n number of analyzed animals

Similar articles

Cited by

References

    1. Alano CC, Tran A, Tao R, Ying W, Karliner JS, Swanson RA. Differences among cell types in NAD(+) compartmentalization: a comparison of neurons, astrocytes, and cardiac myocytes. J Neurosci Res. 2007;85:3378–3385. doi: 10.1002/jnr.21479. - DOI - PubMed
    1. Anderson RM, Weindruch R. Metabolic reprogramming, caloric restriction and aging. Trends Endocrinol Metab. 2010;21:134–141. doi: 10.1016/j.tem.2009.11.005. - DOI - PMC - PubMed
    1. Aspnes LE, Lee CM, Weindruch R, Chung SS, Roecker EB, Aiken JM. Caloric restriction reduces fiber loss and mitochondrial abnormalities in aged rat muscle. FASEB J. 1997;11:573–581. - PubMed
    1. Bagh MB, Thakurta IG, Biswas M, Behera P, Chakrabarti S. Age-related oxidative decline of mitochondrial functions in rat brain is prevented by long term oral antioxidant supplementation. Biogerontology. 2011;12:119–131. doi: 10.1007/s10522-010-9301-8. - DOI - PubMed
    1. Bakala H, Delaval E, Hamelin M, Bismuth J, Borot-Laloi C, Corman B, Friguet B. Changes in rat liver mitochondria with aging. Lon protease-like reactivity and N(epsilon)-carboxymethyllysine accumulation in the matrix. Eur J Biochem. 2003;270:2295–2302. doi: 10.1046/j.1432-1033.2003.03598.x. - DOI - PubMed

Publication types

LinkOut - more resources