. 2012 Sep 3;198(5):913-25.
doi: 10.1083/jcb.201201120.

Polarity and asymmetry in the arrangement of dynein and related structures in the Chlamydomonas axoneme

Affiliations

Polarity and asymmetry in the arrangement of dynein and related structures in the Chlamydomonas axoneme

Khanh Huy Bui et al. J Cell Biol. .

Abstract

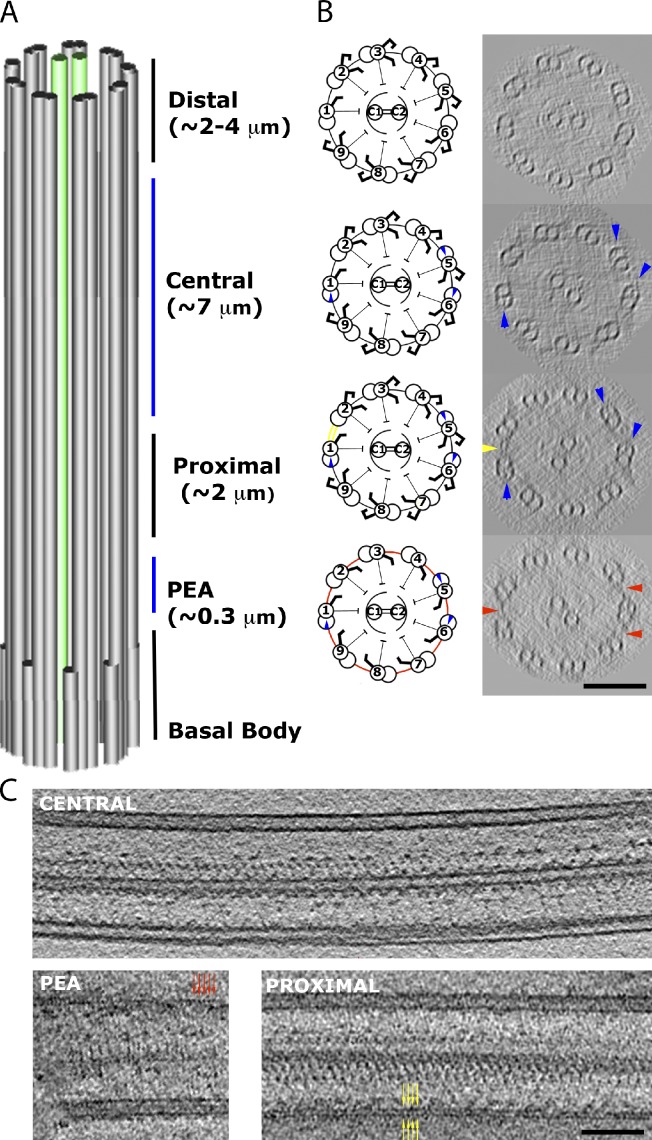
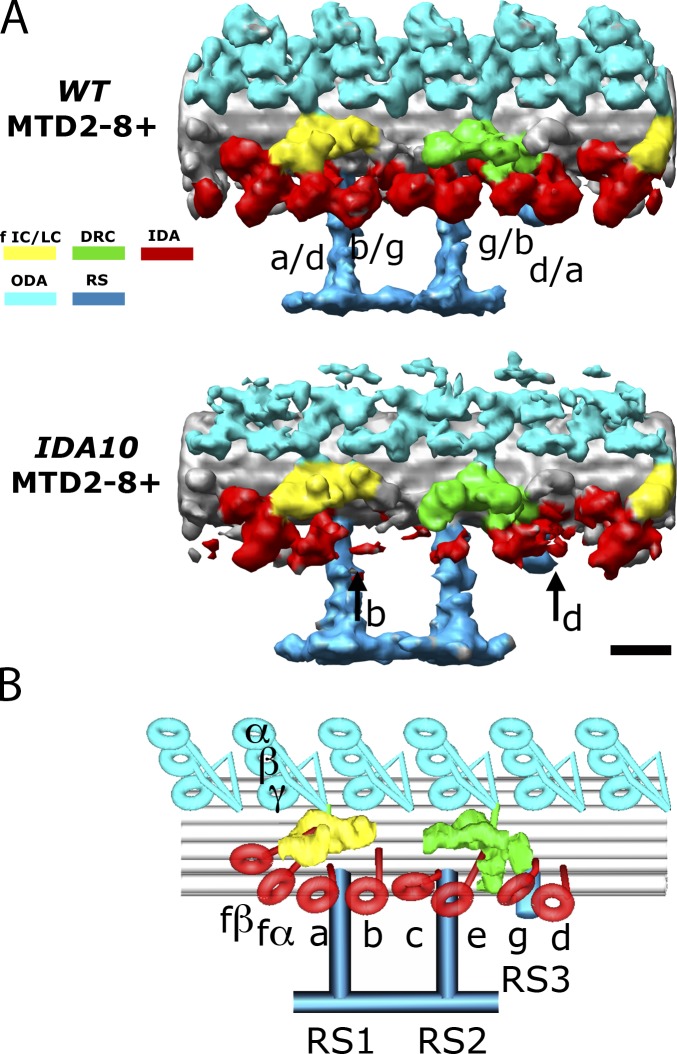
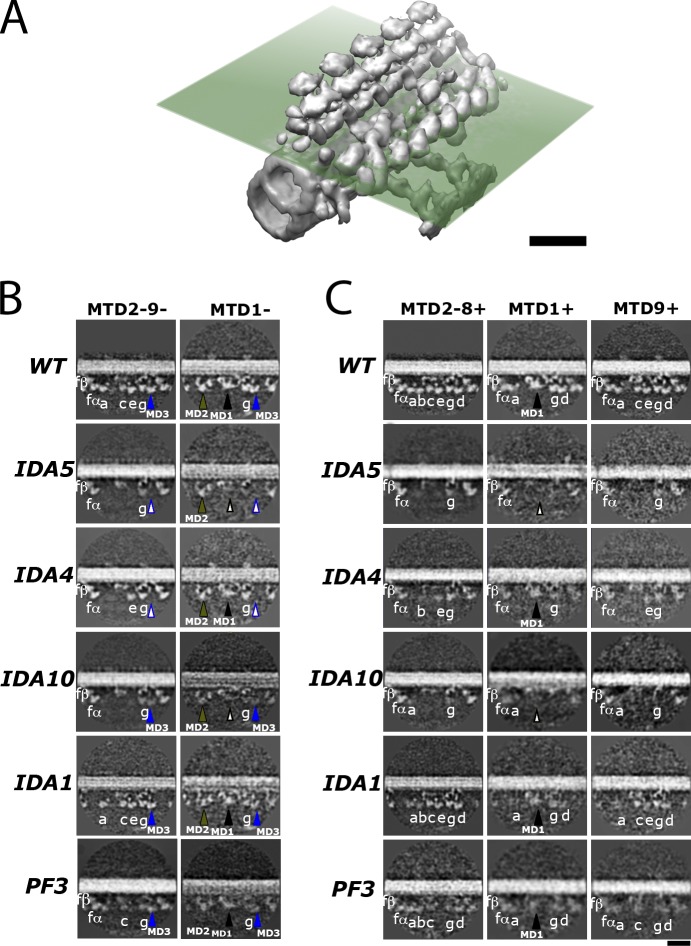
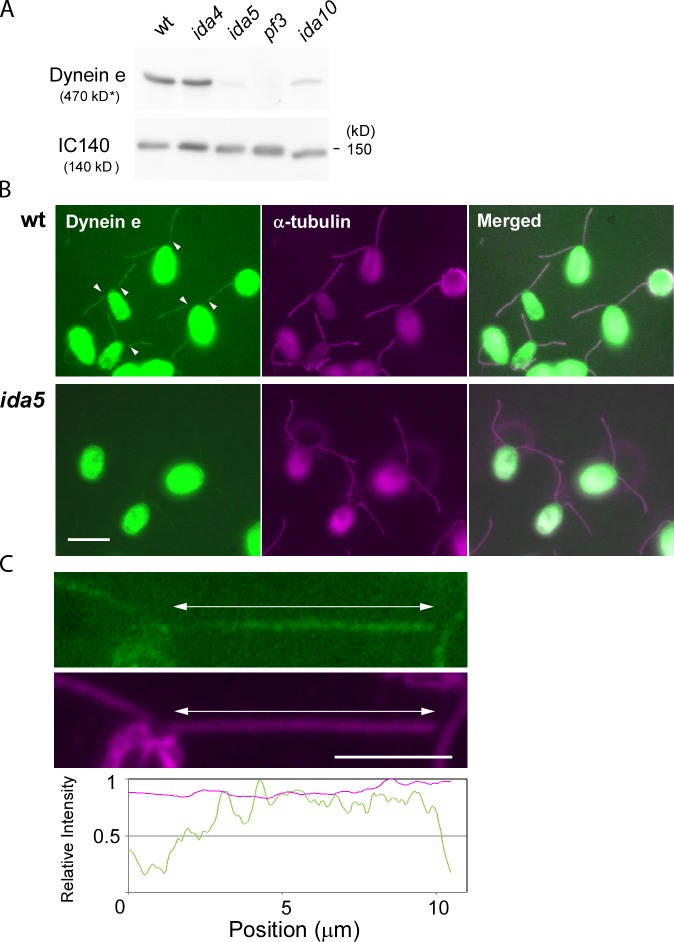
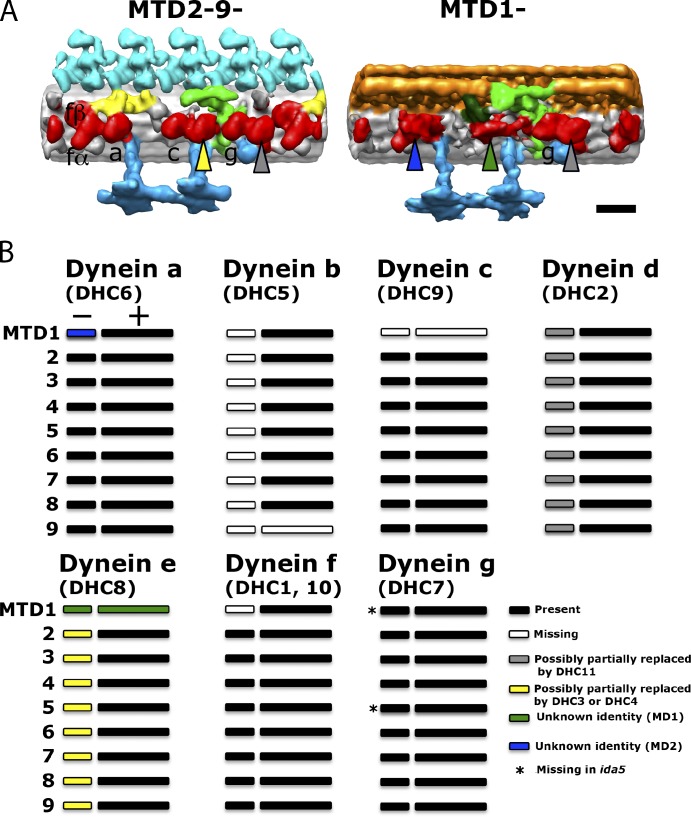
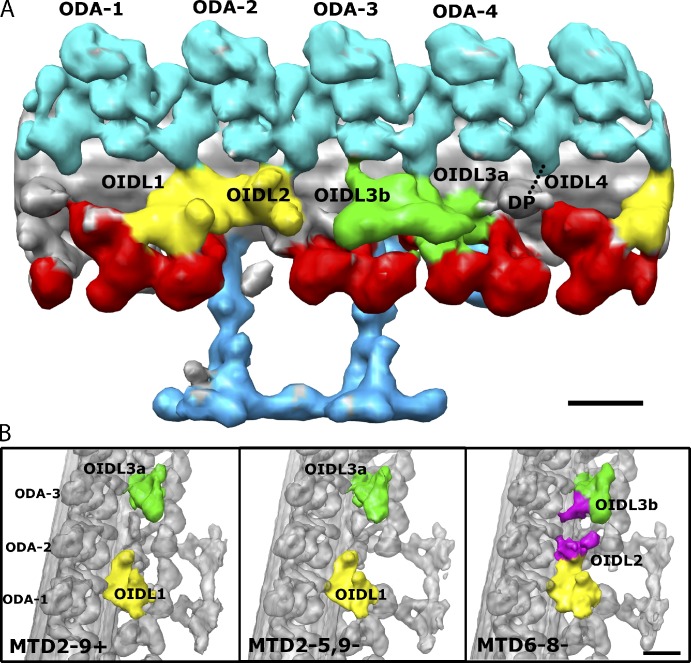
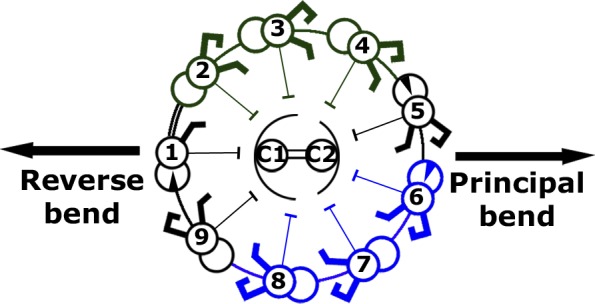
Understanding the molecular architecture of the flagellum is crucial to elucidate the bending mechanism produced by this complex organelle. The current known structure of the flagellum has not yet been fully correlated with the complex composition and localization of flagellar components. Using cryoelectron tomography and subtomogram averaging while distinguishing each one of the nine outer doublet microtubules, we systematically collected and reconstructed the three-dimensional structures in different regions of the Chlamydomonas flagellum. We visualized the radial and longitudinal differences in the flagellum. One doublet showed a distinct structure, whereas the other eight were similar but not identical to each other. In the proximal region, some dyneins were missing or replaced by minor dyneins, and outer-inner arm dynein links were variable among different microtubule doublets. These findings shed light on the intricate organization of Chlamydomonas flagella, provide clues to the mechanism that produces asymmetric flagellar beating, and pose a new challenge for the functional study of the flagella.


Figures

Figure 1.
Figure 1.
Division of the complete Chlamydomonas axoneme. (A) The partitions of the axoneme into four regions: PEA, proximal, central, and distal. (B) Cartoons and representative 96-nm-thick cross-sections of each region from our tomograms, observed from base to tip of the axoneme. The markers of different regions are circumferential interdoublet linkers (red) in the PEA region, the 1–2 bridge (yellow) in the proximal region, and the beaks in MTD1, 5, and 6 (blue) in the central region. No beak was found in the distal region. As a result of the missing wedge effect in the raw tomogram, only three circumferential linkers roughly parallel to the optical axis are seen. Examination of all our data indicates that the circumferential linkers exist between every pair of MTDs in the PEA region, and they are absent from other regions. (C) Single tomographic slices showing the longitudinal sections of flagella in the central region (top), the PEA region (bottom left), and the proximal region (bottom right). The red and yellow arrows indicate a short span of the linkers in the PEA region and the 1–2 bridge, respectively. Bars, 100 nm.
Figure 2.
Figure 2.
Dynein arrangement within the 96-nm unit in the distal region. (A) Comparison of the MTD2-8+ structures in wild type (WT) and ida10 (which has significantly reduced amounts of dyneins b, c, d, and e). In wild-type MTD2-8+, a dynein density labeled with two names (such as a/d) is the one whose identity has been previously unsettled between the two species. The black arrows in ida10 MTD2-8+ indicate the missing densities that were determined to be those of dyneins b and d in this study. Bar, 16 nm. (B) Model of the common IDA architecture in the 96-nm unit showing the complete assignment of all major dynein isoforms. The coloring scheme is as follows: red, IDA; light blue, ODA; turquoise, RS; green, DRC; yellow, dynein f IC/LC. The same coloring scheme is used throughout all figures and supplemental figures unless mentioned otherwise. Surface renderings are always positioned with the proximal part on the left and the distal part on the right unless mentioned otherwise.
Figure 3.
Figure 3.
Dynein structure and arrangement in the whole axoneme. (A) Dynein arrangement in the PEA region. Surface rendering of averaged map of MTD2-9 shows that dyneins b and f (black arrows) are missing. WT, wild type. (B) Comparison between the proximal and distal regions in the MTD groups 1, 2–8, and 9. Minus (−) and plus (+) signs denote the proximal and central/distal regions, respectively. The black arrows indicate the missing dynein b in MTD2-8−, MTD9−, and MTD9+. The orange arrowhead indicates the position of the 1–2 bridge between MTD1− and MTD2−. The blue arrow points to the bulb density that differs between MTD1− and MTD1+ (referred to as MD2 in Fig. 4). Structures shown in orange are the 1–2 bridges, and those in dark green are IDL3, an interdoublet linker between MTD1 and 2 (Bui et al., 2009). (C) View of the section cut perpendicular to the 1–2 bridge of MTD1+ and MTD1−. The black arrowhead shows the dynein f IC/LC in MTD1+, which is missing in MTD1−. (D) Close-up views of a region proximal to RS1 (black frame in B) of MTD1− (left), MTD1+ (middle), and the overlapped image (right). The blue mesh in the right image represents the IDA density of MTD1+ corresponding to the region in red in the middle image. The blue arrowheads point to the tails of MD2 and dynein a. The white arrowheads indicate the bulb density on the A-tubule that is in contact with dynein fα and MD2. Bars, 16 nm.
Figure 4.
Figure 4.
Localization of MDs. (A) Western blot analysis of wild-type (wt), ida4, ida5, ida10, and pf3 axonemes using antibodies to DHC3, DHC4, DHC11, and IC140 (an IC of dynein f, used as a positive control). The molecular masses of DHC3, DHC4, and DHC11 are expected values, as they migrate significantly more slowly than the 250-kD molecular mass marker, which is not shown. (B) The 96-nm surface renderings of MTD2-8+ and MTD1+ of wild type and MTD2-9− and MTD1− of wild type, ida4, ida5, ida10, ida1, and pf3. There are three MD densities that deviated from the common inner-arm dynein structures, MD1–3, indicated with arrowheads in different colors. They can be the candidates of the MDs. A filled arrowhead indicates the presence of dynein, whereas an open arrowhead with the same border color indicates the absence of dynein from the respective position. Bar, 16 nm.
Figure 5.
Figure 5.
Sections showing the dyneins in wild-type and mutant axonemes. (A–C) Illustration of the cross-section plane (transparent dissecting plane; A) in B and C in relation to the isosurface structure. Cross-sections of density maps of wild type (WT) and mutants in the proximal (B) and distal (C) regions in wild type, ida5, ida4, ida10, ida1, and pf3 are shown. The color of each arrowhead is the same as in Fig. 4. Bars, 32 nm.
Figure 6.
Figure 6.
Immunofluorescence localization of inner-arm dynein e. (A) Immunoblot analysis of wild-type (wt), ida4, ida5, ida10, and pf3 axonemes using antibodies against dynein e heavy chains and IC140 (positive control). The molecular mass of dynein e is the expected value, as dynein e migrates significantly more slowly than the 250-kD molecular mass marker, which is not shown. The reduction of dynein e in ida10 is consistent with the previous result (Yamamoto et al., 2010). (B) Indirect immunofluorescence observation of inner-arm dynein e (left; green signal) and α-tubulin (middle; purple signal) in wild-type and ida5 cells. The right images show the merged images. Note that almost no dynein e signal was detected in ida5 axonemes. The dynein e signals in the proximal region of wild-type axonemes are significantly reduced compared with the distal regions. The boundaries are indicated with white arrowheads. Bar, 10 µm. (C) Magnified images of part of a wild-type cell and the densitometric evaluation of the signal intensities of dynein e and acetylated tubulin along the flagellum. The nucleoflagellar apparatus (see Materials and methods) was analyzed. The entire length of flagella is shown by double-headed arrows. Bar, 5 µm.
Figure 7.
Figure 7.
Possible assignment of dynein locations. (A) Assignment of the potential location of the three MDs (DHC3, DHC4, and DHC11) in the proximal region. The arrowheads indicate possible locations: possibly, DHC3 and DHC4 are at the yellow arrowhead, and DHC11 is at the gray arrowheads. Densities at the other arrowheads are not assigned. DHC3 may be present also on MTD1+. Bar, 16 nm. (B) The proposed distribution of all the major dyneins along the flagella. The colors of the bar indicating possible localization corresponds to the MD or unknown density pointed by the same arrowhead colors in A. The short bar with the minus sign indicates the proximal region of the MTD, whereas the long bar with the plus sign indicates the central and distal region.
Figure 8.
Figure 8.
Asymmetry and polar differences in the number of the OID linkers. (A) Surface rendering of MTD6-8− showing all the OIDLs (OIDL1, OIDL2, OIDL3a and b, and OIDL4) found between ODAs and IDAs in the axoneme. ODAs are numbered 1–4 from proximal to distal direction. ODA-1 is the one with the tail contacting to the dynein f IC/LC. DP is a density called the distal protrusion. OIDL4 is visible in not all MTD6-8−; it is present in specific MTDs such as MTD2− and MTD7− (Fig. S4). (B) Highlights of the differences between OIDLs in MTD2-9+, MTD2-5,9− and MTD6-8−. From the comparison, OIDL2 and OIDL3b (colored in purple) are extra density protruding from the dynein f IC/LC and the DRC, respectively. The density of OIDL2 and OIDL3b was determined from the difference map between MTD6-8− and MTD2-4−. The proximal end of the doublet is toward the lower part of the image. Bar, 16 nm.
Figure 9.
Figure 9.
Summary of the observed structural polarization and asymmetry in the axoneme and their possible importance for bending motion. The division of the axoneme into MTD groups based on the OIDLs structures. The group of MTD2–3–4 (dark green) has almost the same OIDLs in the proximal and central regions, whereas the group of MTD6–7–8 (blue) has extra OIDLs and density in the proximal region than in central regions.

References

    1. Bessen M., Fay R.B., Witman G.B. 1980. Calcium control of waveform in isolated flagellar axonemes of Chlamydomonas. J. Cell Biol. 86:446–455 10.1083/jcb.86.2.446 - DOI - PMC - PubMed
    1. Bui K.H., Sakakibara H., Movassagh T., Oiwa K., Ishikawa T. 2008. Molecular architecture of inner dynein arms in situ in Chlamydomonas reinhardtii flagella. J. Cell Biol. 183:923–932 10.1083/jcb.200808050 - DOI - PMC - PubMed
    1. Bui K.H., Sakakibara H., Movassagh T., Oiwa K., Ishikawa T. 2009. Asymmetry of inner dynein arms and inter-doublet links in Chlamydomonas flagella. J. Cell Biol. 186:437–446 10.1083/jcb.200903082 - DOI - PMC - PubMed
    1. Dentler W.L., Rosenbaum J.L. 1977. Flagellar elongation and shortening in Chlamydomonas. III. Structures attached to the tips of flagellar microtubules and their relationship to the directionality of flagellar microtubule assembly. J. Cell Biol. 74:747–759 10.1083/jcb.74.3.747 - DOI - PMC - PubMed
    1. Dutcher S.K. 1995. Flagellar assembly in two hundred and fifty easy-to-follow steps. Trends Genet. 11:398–404 10.1016/S0168-9525(00)89123-4 - DOI - PubMed

Publication types