

Identification of retinol binding protein 1 promoter hypermethylation in isocitrate dehydrogenase 1 and 2 mutant gliomas
- PMID: 22945948
- PMCID: PMC3529615
- DOI: 10.1093/jnci/djs357
Identification of retinol binding protein 1 promoter hypermethylation in isocitrate dehydrogenase 1 and 2 mutant gliomas
Abstract
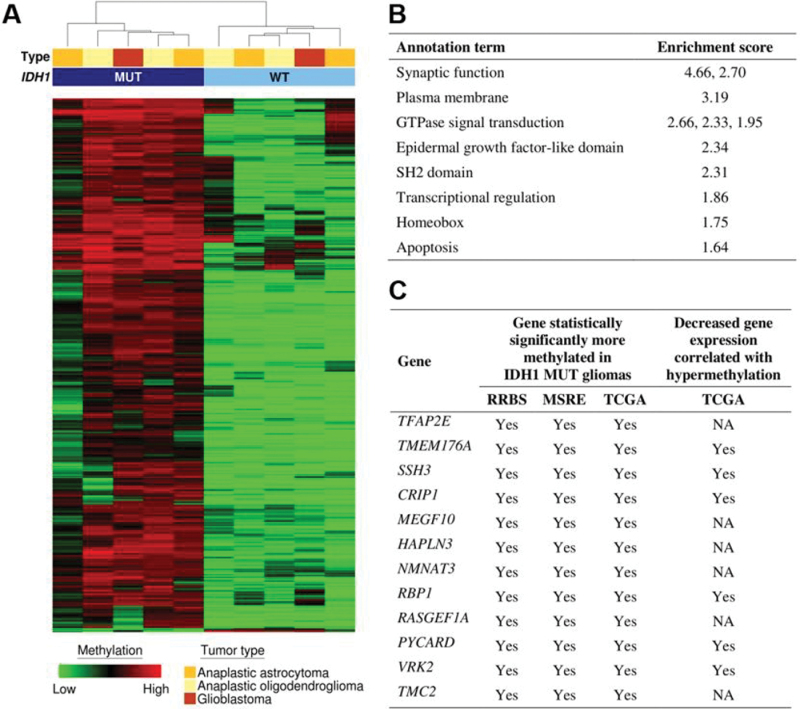
Background: Mutations in isocitrate dehydrogenase 1 (IDH1) and associated CpG island hypermethylation represent early events in the development of low-grade gliomas and secondary glioblastomas. To identify candidate tumor suppressor genes whose promoter methylation may contribute to gliomagenesis, we compared methylation profiles of IDH1 mutant (MUT) and IDH1 wild-type (WT) tumors using massively parallel reduced representation bisulfite sequencing.
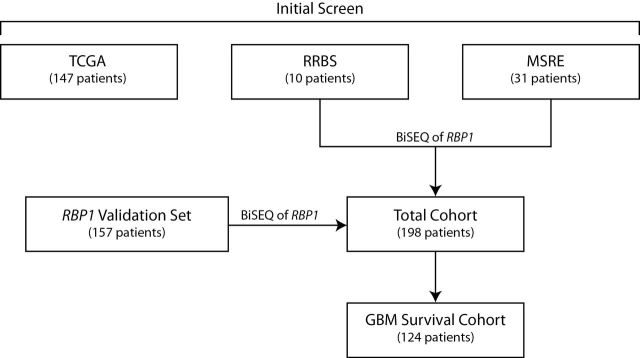
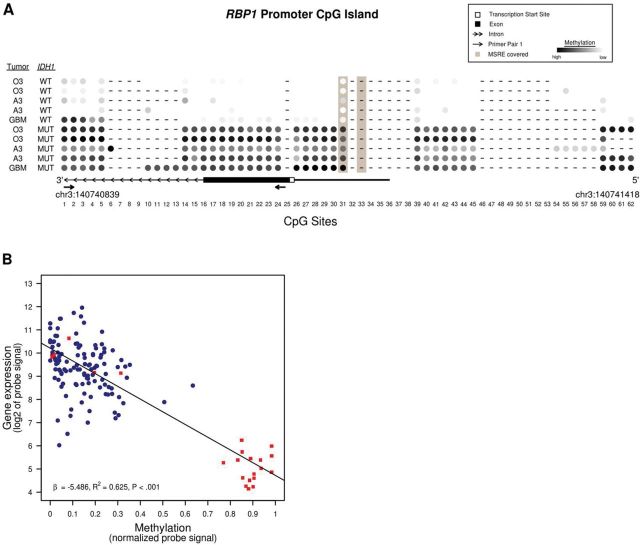
Methods: Reduced representation bisulfite sequencing was performed on ten pathologically matched WT and MUT glioma samples and compared with data from a methylation-sensitive restriction enzyme technique and data from The Cancer Genome Atlas (TCGA). Methylation in the gene retinol-binding protein 1 (RBP1) was identified in IDH1 mutant tumors and further analyzed with primer-based bisulfite sequencing. Correlation between IDH1/IDH2 mutation status and RBP1 methylation was evaluated with Spearman correlation. Survival data were collected retrospectively and analyzed with Kaplan-Meier and Cox proportional hazards analysis. All statistical tests were two-sided.
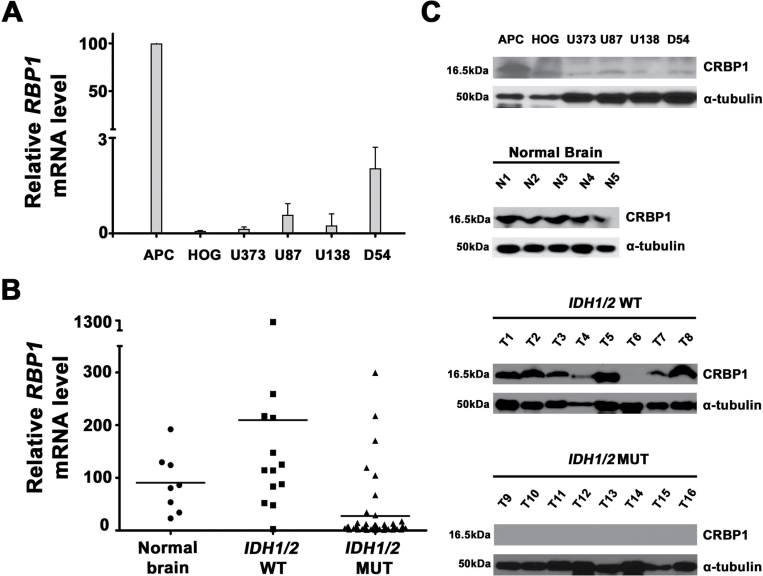
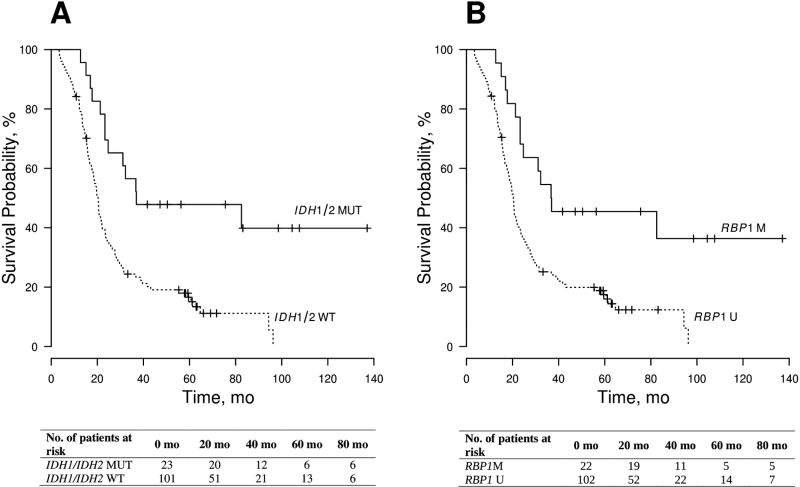
Results: Methylome analysis identified coordinated CpG island hypermethylation in IDH1 MUT gliomas, consistent with previous reports. RBP1, important in retinoic acid metabolism, was found to be hypermethylated in 76 of 79 IDH1 MUT, 3 of 3 IDH2 MUT, and 0 of 116 IDH1/IDH2 WT tumors. IDH1/IDH2 mutation was highly correlated with RBP1 hypermethylation (n = 198; Spearman R = 0.94, 95% confidence interval = 0.92 to 0.95, P < .001). The Cancer Genome Atlas showed IDH1 MUT tumors (n = 23) to be RBP1-hypermethylated with decreased RBP1 expression compared with WT tumors (n = 124). Among patients with primary glioblastoma, patients with RBP1-unmethylated tumors (n = 102) had decreased median overall survival compared with patients with RBP1-methylated tumors (n = 22) (20.3 months vs 36.8 months, respectively; hazard ratio of death = 2.48, 95% confidence interval = 1.30 to 4.75, P = .006).
Conclusion: RBP1 promoter hypermethylation is found in nearly all IDH1 and IDH2 mutant gliomas and is associated with improved patient survival. Because RBP1 is involved in retinoic acid synthesis, our results suggest that dysregulation of retinoic acid metabolism may contribute to glioma formation along the IDH1/IDH2-mutant pathway.
Figures
Similar articles
-
Tumor-suppressive miR148a is silenced by CpG island hypermethylation in IDH1-mutant gliomas.Clin Cancer Res. 2014 Nov 15;20(22):5808-22. doi: 10.1158/1078-0432.CCR-14-0234. Epub 2014 Sep 15. Clin Cancer Res. 2014. PMID: 25224277 Free PMC article.
-
Isocitrate Dehydrogenase Mutations are Better Prognostic Marker than O6-methylguanine-DNA Methyltransferase Promoter Methylation in Glioblastomas - a Retrospective, Single-centre Molecular Genetics Study of Gliomas.Klin Onkol. 2017 Fall;30(5):361-371. doi: 10.14735/amko2017361. Klin Onkol. 2017. PMID: 29031038 English.
-
SPINT2 is hypermethylated in both IDH1 mutated and wild-type glioblastomas, and exerts tumor suppression via reduction of c-Met activation.J Neurooncol. 2019 May;142(3):423-434. doi: 10.1007/s11060-019-03126-x. Epub 2019 Mar 5. J Neurooncol. 2019. PMID: 30838489 Free PMC article.
-
O6-methylguanine DNA methyltransferase gene promoter methylation status in gliomas and its correlation with other molecular alterations: first Indian report with review of challenges for use in customized treatment.Neurosurgery. 2010 Dec;67(6):1681-91. doi: 10.1227/NEU.0b013e3181f743f5. Neurosurgery. 2010. PMID: 21107199 Review.
-
Overview of DNA methylation in adult diffuse gliomas.Brain Tumor Pathol. 2019 Apr;36(2):84-91. doi: 10.1007/s10014-019-00339-w. Epub 2019 Apr 1. Brain Tumor Pathol. 2019. PMID: 30937703 Review.
Cited by
-
Exploiting metabolic vulnerabilities for personalized therapy in acute myeloid leukemia.BMC Biol. 2019 Jul 18;17(1):57. doi: 10.1186/s12915-019-0670-4. BMC Biol. 2019. PMID: 31319822 Free PMC article. Review.
-
Retinol-binding protein type 1 expression predicts poor prognosis in head and neck squamous cell carcinoma.BMC Cancer. 2024 Oct 15;24(1):1277. doi: 10.1186/s12885-024-12565-3. BMC Cancer. 2024. PMID: 39407127 Free PMC article.
-
Role of MDH2 pathogenic variant in pheochromocytoma and paraganglioma patients.Genet Med. 2018 Dec;20(12):1652-1662. doi: 10.1038/s41436-018-0068-7. Epub 2018 Jul 16. Genet Med. 2018. PMID: 30008476 Free PMC article.
-
C-terminally truncated form of αB-crystallin is associated with IDH1 R132H mutation in anaplastic astrocytoma.J Neurooncol. 2014 Mar;117(1):53-65. doi: 10.1007/s11060-014-1371-z. Epub 2014 Jan 29. J Neurooncol. 2014. PMID: 24473683
-
Downregulation of TES by hypermethylation in glioblastoma reduces cell apoptosis and predicts poor clinical outcome.Eur J Med Res. 2014 Dec 11;19(1):66. doi: 10.1186/s40001-014-0066-4. Eur J Med Res. 2014. PMID: 25498217 Free PMC article.
References
Publication types
MeSH terms
Substances
Grants and funding
LinkOut - more resources
Full Text Sources
Other Literature Sources
Medical
Research Materials
Miscellaneous
