

Upregulation of the angiotensin-converting enzyme 2/angiotensin-(1-7)/Mas receptor axis in the heart and the kidney of growth hormone receptor knock-out mice
- PMID: 22947377
- PMCID: PMC3698955
- DOI: 10.1016/j.ghir.2012.08.003
Upregulation of the angiotensin-converting enzyme 2/angiotensin-(1-7)/Mas receptor axis in the heart and the kidney of growth hormone receptor knock-out mice
Abstract
Objective: Growth hormone (GH) resistance leads to enhanced insulin sensitivity, decreased systolic blood pressure and increased lifespan. The aim of this study was to determine if there is a shift in the balance of the renin-angiotensin system (RAS) towards the ACE2/Ang-(1-7)/Mas receptor axis in the heart and the kidney of a model of GH resistance and retarded aging, the GH receptor knockout (GHR-/-) mouse.
Design: RAS components were evaluated in the heart and the kidney of GHR-/- and control mice by immunohistochemistry and Western blotting (n=12 for both groups).
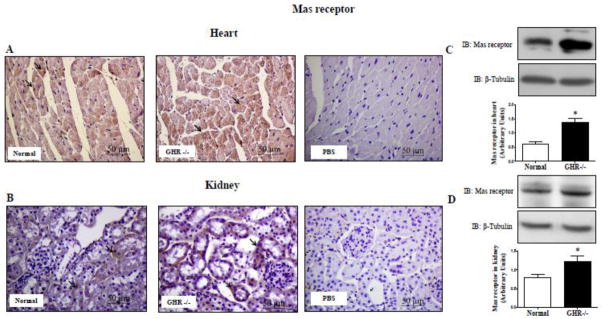
Results: The immunostaining of Ang-(1-7) was increased in both the heart and the kidney of GHR-/- mice. These changes were concomitant with an increased immunostaining of the Mas receptor and ACE2 in both tissues. The immunostaining of AT1 receptor was reduced in heart and kidney of GHR-/- mice while that of AT2 receptor was increased in the heart and unaltered in the kidney. Ang II, ACE and angiotensinogen levels remained unaltered in the heart and the kidney of GH resistant mice. These results were confirmed by Western blotting and correlated with a significant increase in the abundance of the endothelial nitric oxide synthase in both tissues.
Conclusions: The shift within the RAS towards an exacerbation of the ACE2/Ang-(1-7)/Mas receptor axis observed in GHR-/- mice could be related to a protective role in cardiac and renal function; and thus, possibly contribute to the decreased incidence of cardiovascular diseases displayed by this animal model of longevity.
Copyright © 2012 Elsevier Ltd. All rights reserved.
Figures


Similar articles
-
Downregulation of the ACE2/Ang-(1-7)/Mas axis in transgenic mice overexpressing GH.J Endocrinol. 2014 Apr 22;221(2):215-27. doi: 10.1530/JOE-13-0497. Print 2014 May. J Endocrinol. 2014. PMID: 24756097 Free PMC article.
-
ACE2, angiotensin-(1–7), and Mas: the other side of the coin.Pflugers Arch. 2013 Jan;465(1):79-85. doi: 10.1007/s00424-012-1120-0. Pflugers Arch. 2013. PMID: 23463883 Review.
-
High Na intake increases renal angiotensin II levels and reduces expression of the ACE2-AT(2)R-MasR axis in obese Zucker rats.Am J Physiol Renal Physiol. 2012 Aug 1;303(3):F412-9. doi: 10.1152/ajprenal.00097.2012. Epub 2012 May 16. Am J Physiol Renal Physiol. 2012. PMID: 22592638 Free PMC article.
-
The angiotensin-converting enzyme 2/angiotensin (1-7)/Mas axis protects the function of pancreatic β cells by improving the function of islet microvascular endothelial cells.Int J Mol Med. 2014 Nov;34(5):1293-300. doi: 10.3892/ijmm.2014.1917. Epub 2014 Aug 28. Int J Mol Med. 2014. PMID: 25175177
-
New insights and perspectives on intrarenal renin-angiotensin system: focus on intracrine/intracellular angiotensin II.Peptides. 2011 Jul;32(7):1551-65. doi: 10.1016/j.peptides.2011.05.012. Epub 2011 Jun 14. Peptides. 2011. PMID: 21699940 Free PMC article. Review.
Cited by
-
MAS-mediated antioxidant effects restore the functionality of angiotensin converting enzyme 2-angiotensin-(1-7)-MAS axis in diabetic rat carotid.Biomed Res Int. 2014;2014:640329. doi: 10.1155/2014/640329. Epub 2014 Apr 29. Biomed Res Int. 2014. PMID: 24877125 Free PMC article.
-
Elevated systolic blood pressure in male GH transgenic mice is age dependent.Endocrinology. 2014 Mar;155(3):975-86. doi: 10.1210/en.2013-1899. Epub 2013 Jan 1. Endocrinology. 2014. PMID: 24424040 Free PMC article.
-
A Suggested Role of Human Growth Hormone in Control of the COVID-19 Pandemic.Front Endocrinol (Lausanne). 2020 Nov 9;11:569633. doi: 10.3389/fendo.2020.569633. eCollection 2020. Front Endocrinol (Lausanne). 2020. PMID: 33240216 Free PMC article.
-
Reporting a novel growth hormone receptor gene variant in an Iranian consanguineous pedigree with Laron syndrome: a case report.BMC Endocr Disord. 2023 Jul 20;23(1):155. doi: 10.1186/s12902-023-01388-1. BMC Endocr Disord. 2023. PMID: 37474955 Free PMC article.
-
Chronic treatment with C-type natriuretic peptide impacts differently in the aorta of normotensive and hypertensive rats.Pflugers Arch. 2019 Aug;471(8):1103-1115. doi: 10.1007/s00424-019-02287-y. Epub 2019 Jun 11. Pflugers Arch. 2019. PMID: 31187260
References
-
- Waters MJ, Hoang HN, Fairlie DP, Pelekanos RA, Brown RJ. New insights into growth hormone action. J Mol Endocrinol. 2006;36:1–7. - PubMed
-
- Coschigano KT, Clemmons D, Bellush LL, Kopchick JJ. Assessment of growth parameters and life span of GHR/BP gene-disrupted mice. Endocrinology. 2000;141:2608–2613. - PubMed
-
- Dominici FP, Arostegui Diaz G, Bartke A, Kopchick JJ, Turyn D. Compensatory alterations of insulin signal transduction in liver of growth hormone receptor knockout mice. J Endocrinol. 2000;166:579–590. - PubMed
Publication types
MeSH terms
Substances
Grants and funding
LinkOut - more resources
Full Text Sources
Molecular Biology Databases
Research Materials
Miscellaneous
