

Atomic force microscopy stiffness tomography on living Arabidopsis thaliana cells reveals the mechanical properties of surface and deep cell-wall layers during growth
- PMID: 22947854
- PMCID: PMC3414883
- DOI: 10.1016/j.bpj.2012.06.046
Atomic force microscopy stiffness tomography on living Arabidopsis thaliana cells reveals the mechanical properties of surface and deep cell-wall layers during growth
Abstract
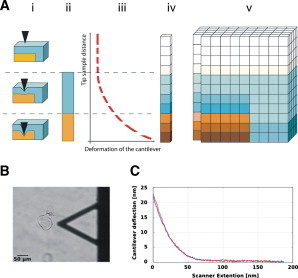
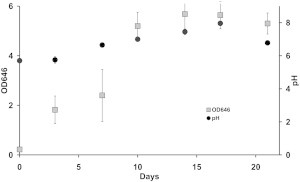
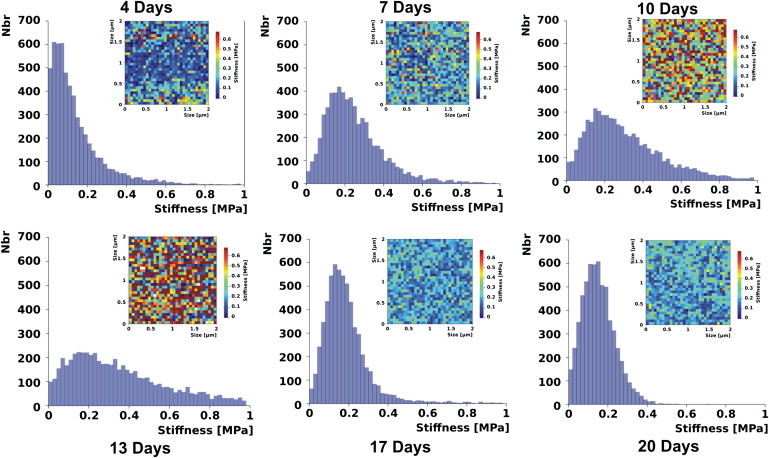
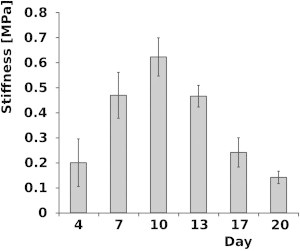
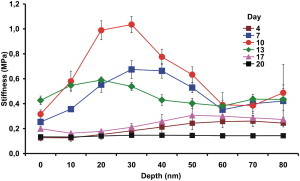
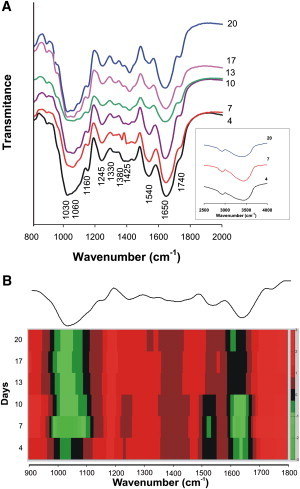
Cell-wall mechanical properties play a key role in the growth and the protection of plants. However, little is known about genuine wall mechanical properties and their growth-related dynamics at subcellular resolution and in living cells. Here, we used atomic force microscopy (AFM) stiffness tomography to explore stiffness distribution in the cell wall of suspension-cultured Arabidopsis thaliana as a model of primary, growing cell wall. For the first time that we know of, this new imaging technique was performed on living single cells of a higher plant, permitting monitoring of the stiffness distribution in cell-wall layers as a function of the depth and its evolution during the different growth phases. The mechanical measurements were correlated with changes in the composition of the cell wall, which were revealed by Fourier-transform infrared (FTIR) spectroscopy. In the beginning and end of cell growth, the average stiffness of the cell wall was low and the wall was mechanically homogenous, whereas in the exponential growth phase, the average wall stiffness increased, with increasing heterogeneity. In this phase, the difference between the superficial and deep wall stiffness was highest. FTIR spectra revealed a relative increase in the polysaccharide/lignin content.
Copyright © 2012 Biophysical Society. Published by Elsevier Inc. All rights reserved.
Figures
Similar articles
-
In vivo analysis of local wall stiffness at the shoot apical meristem in Arabidopsis using atomic force microscopy.Plant J. 2011 Sep;67(6):1116-23. doi: 10.1111/j.1365-313X.2011.04649.x. Epub 2011 Jul 4. Plant J. 2011. PMID: 21605208
-
Pectin-induced changes in cell wall mechanics underlie organ initiation in Arabidopsis.Curr Biol. 2011 Oct 25;21(20):1720-6. doi: 10.1016/j.cub.2011.08.057. Epub 2011 Oct 6. Curr Biol. 2011. PMID: 21982593
-
Use of Atomic Force Microscopy to Measure Mechanical Properties and Turgor Pressure of Plant Cells and Plant Tissues.J Vis Exp. 2019 Jul 15;(149). doi: 10.3791/59674. J Vis Exp. 2019. PMID: 31355790
-
Hierarchies of plant stiffness.Plant Sci. 2016 Sep;250:79-96. doi: 10.1016/j.plantsci.2016.06.002. Epub 2016 Jun 3. Plant Sci. 2016. PMID: 27457986 Review.
-
Use of atomic force microscopy (AFM) to explore cell wall properties and response to stress in the yeast Saccharomyces cerevisiae.Curr Genet. 2013 Nov;59(4):187-96. doi: 10.1007/s00294-013-0411-0. Epub 2013 Sep 27. Curr Genet. 2013. PMID: 24071902 Review.
Cited by
-
Causal factors concerning the texture of French fries manufactured at industrial scale.Curr Res Food Sci. 2024 Feb 21;8:100706. doi: 10.1016/j.crfs.2024.100706. eCollection 2024. Curr Res Food Sci. 2024. PMID: 38435276 Free PMC article. Review.
-
A comparative mechanical analysis of plant and animal cells reveals convergence across kingdoms.Biophys J. 2014 Nov 18;107(10):2237-44. doi: 10.1016/j.bpj.2014.10.023. Biophys J. 2014. PMID: 25418292 Free PMC article.
-
Cytoskeleton as a generator of characteristic physical properties of plant cells: 'cell wall,' 'large vacuole,' and 'cytoplasmic streaming'.Biophys Physicobiol. 2025 Jun 20;22(3):e220013. doi: 10.2142/biophysico.bppb-v22.0013. eCollection 2025. Biophys Physicobiol. 2025. PMID: 40787037 Free PMC article.
-
Tensile Testing Assay for the Measurement of Tissue Stiffness in Arabidopsis Inflorescence Stem.Bio Protoc. 2019 Aug 5;9(15):e3327. doi: 10.21769/BioProtoc.3327. eCollection 2019 Aug 5. Bio Protoc. 2019. PMID: 33654834 Free PMC article.
-
Mechano-chemical aspects of organ formation in Arabidopsis thaliana: the relationship between auxin and pectin.PLoS One. 2013;8(3):e57813. doi: 10.1371/journal.pone.0057813. Epub 2013 Mar 12. PLoS One. 2013. PMID: 23554870 Free PMC article.
References
-
- Cosgrove D.J. Wall extensibility: its nature, measurement and relationship to plant cell growth. New Phytol. 1993;124:1–23. - PubMed
-
- Cosgrove D.J. Assembly and enlargement of the primary cell wall in plants. Annu. Rev. Cell Dev. Biol. 1997;13:171–201. - PubMed
-
- Cosgrove D.J. Growth of the plant cell wall. Nat. Rev. Mol. Cell Biol. 2005;6:850–861. - PubMed
-
- Cousins W.J., Armstrong R.W., Robinson W.H. Young’s modulus of lignin from a continuous indentation test. J. Mater. Sci. 1976;10:1655–1658.
-
- Cousins W.J. Young’s modulus of hemicellulose as related to moisture content. Wood Sci. Technol. 1978;12:161–167.
Publication types
MeSH terms
LinkOut - more resources
Full Text Sources
Molecular Biology Databases
Miscellaneous
