. 2012 Aug 8;103(3):501-510.
doi: 10.1016/j.bpj.2012.06.031.

Mechanical coupling between myosin molecules causes differences between ensemble and single-molecule measurements

Affiliations

Mechanical coupling between myosin molecules causes differences between ensemble and single-molecule measurements

Sam Walcott et al. Biophys J. .

Abstract

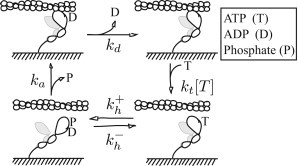
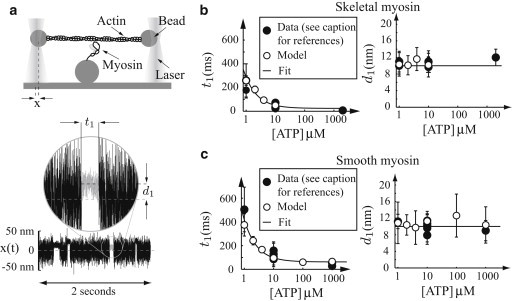
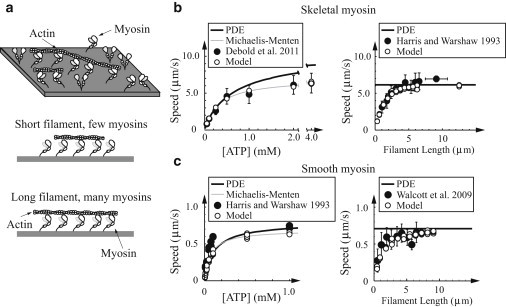
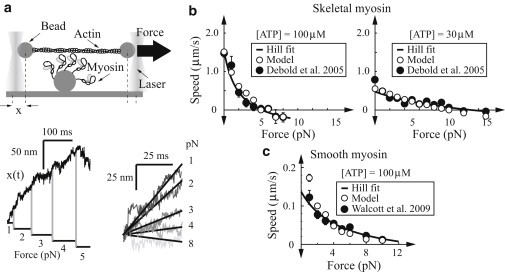
In contracting muscle, individual myosin molecules function as part of a large ensemble, hydrolyzing ATP to power the relative sliding of actin filaments. The technological advances that have enabled direct observation and manipulation of single molecules, including recent experiments that have explored myosin's force-dependent properties, provide detailed insight into the kinetics of myosin's mechanochemical interaction with actin. However, it has been difficult to reconcile these single-molecule observations with the behavior of myosin in an ensemble. Here, using a combination of simulations and theory, we show that the kinetic mechanism derived from single-molecule experiments describes ensemble behavior; but the connection between single molecule and ensemble is complex. In particular, even in the absence of external force, internal forces generated between myosin molecules in a large ensemble accelerate ADP release and increase how far actin moves during a single myosin attachment. These myosin-induced changes in strong binding lifetime and attachment distance cause measurable properties, such as actin speed in the motility assay, to vary depending on the number of myosin molecules interacting with an actin filament. This ensemble-size effect challenges the simple detachment limited model of motility, because even when motility speed is limited by ADP release, increasing attachment rate can increase motility speed.


Figures

Figure 1
Figure 1
Kinetic scheme for the interaction of actin and myosin. (Starting at the lower left) Myosin releases phosphate, strongly binds to actin, and undergoes a power stroke (not necessarily in that order) at a rate ka. It releases ADP at a rate kd. Strong binding is terminated by the binding of ATP at a rate kt[T], where [T] is the concentration of ATP. Hydrolysis of ATP reverses the power stroke and reprimes the head. Although both heads of myosin are pictured, we only consider the action of the unshaded head and do not imply anything about intramolecular head-head interactions.
Figure 2
Figure 2
Model is consistent with single-molecule measurements in the laser trap. In all plots: (open circles) Simulated data; (solid circles) experimental data. (Error bars) Standard deviations. (a) A cartoon of a single-molecule experiment. Actin, manipulated by two beads trapped in lasers, is brought close to a myosin molecule that can then bind. The position of one laser-trapped bead x(t) is measured with a quadrant photodiode as a function of time, and the duration of binding (t1) and myosin’s step size (d1) may be measured. A typical simulated experiment is pictured (compare to Fig. 2 of Baker et al. (11)). (b and c) Same plots for skeletal muscle and smooth muscle myosin, respectively. (Left plot) Strong binding lifetime as a function of ATP. The simulated data are fit with an equation of the form t1 = 1/kd0 + 1/kt[ATP] (solid line). (Right plot) Unitary step size d1 as a function of ATP. (Solid line) d1 = 10 nm. Data are from the literature (5,6,8,39,40,43) for smooth muscle and the literature (2,5,37,41,42) for skeletal muscle myosin.
Figure 3
Figure 3
Model is consistent with small and large ensemble measurements in the absence of external force. (a) Cartoon of experimental setup. (Top) Motility assay, with free actin filaments moving across a bed of myosin. (Bottom) Number of myosin molecules interacting with actin depends on filament length. (b and c) Same plots for skeletal and smooth muscle myosin, respectively. In all plots: (open circles) simulated data; (solid circles) experimental data. (Error bars, when present) Standard deviations. (Solid) Numerical solution of the integro-partial differential equations (PDEs) that govern the model in the limit of large N. (Left) In vitro motility at high myosin density as a function of ATP. (Shaded line) Michaelis-Menten fits. Skeletal muscle simulations agree with the experimental measurements (45), given N = 50. The Km of the smooth muscle fits differ from measurements (44) (70.4 μM and 46 μM, respectively). This difference might be due to temperature differences or experimental variation. (Right) In vitro motility speed at low myosin density as a function of filament length. The model is consistent with the data of Harris and Warshaw (44), given 16 active myosin heads/μm (skeletal) and Walcott et al. (43), given 11 active myosin heads/μm (smooth).
Figure 4
Figure 4
Model fits small ensemble force-velocity measurements. (a) Cartoon of experimental setup. (Top) Actin, manipulated by two beads trapped in lasers, is brought close to a small ensemble of myosin molecules that can then bind. The position of one laser-trapped bead is measured as a function of time x(t), and the position of the laser is dynamically adjusted to keep a constant force on the system. (Bottom left) Typical simulation of bead position versus time (compare to Fig. 1, B and C, of Debold et al. (30)). These simulations were for 11 active skeletal muscle myosin heads at 100 μM ATP. Applied force is shown below. (Right) Five position-versus-time simulations, aligned to emphasize how applied force slows actin speed. Force-velocity plots are shown for (b) skeletal and (c) smooth muscle myosin. (Solid circles) Data (30,43); (open circles) simulations. A quantity of 11 and 8 active myosin heads were simulated for skeletal and smooth myosin, respectively. (Error bars) Standard error. (Solid curves) Hill fits to the data (31).
Figure 5
Figure 5
Comparison between theoretical calculations and simulations for actin speed (V), myosin attachment time (T), and attachment distance (D), all normalized to the single-molecule values (single-molecule values are shown as a thin, solid line). These plots are shown as a function of the nondimensional mechanochemical coupling parameter E. Simulations were performed with large ensembles (N = 400) with kinetic parameters based on smooth muscle and skeletal muscle. The value E was varied by using different myosin stiffness values and/or force dependence. (Dashed lines) Our best estimate of E. Theoretical calculations, described in the text and the Supporting Material, agree with the simulations.

Similar articles

Cited by

References

    1. Lymn R.W., Taylor E.W. Mechanism of adenosine triphosphate hydrolysis by actomyosin. Biochemistry. 1971;10:4617–4624. - PubMed
    1. Finer J.T., Simmons R.M., Spudich J.A. Single myosin molecule mechanics: picoNewton forces and nanometer steps. Nature. 1994;368:113–119. - PubMed
    1. Ishijima A., Harada Y., Yanagida T. Single-molecule analysis of the actomyosin motor using nano-manipulation. Biochem. Biophys. Res. Commun. 1994;199:1057–1063. - PubMed
    1. Molloy J.E., Burns J.E., White D.C. Movement and force produced by a single myosin head. Nature. 1995;378:209–212. - PubMed
    1. Guilford W.H., Dupuis D.E., Warshaw D.M. Smooth muscle and skeletal muscle myosins produce similar unitary forces and displacements in the laser trap. Biophys. J. 1997;72:1006–1021. - PMC - PubMed

Publication types