

High density waves of the bacterium Pseudomonas aeruginosa in propagating swarms result in efficient colonization of surfaces
- PMID: 22947877
- PMCID: PMC3414888
- DOI: 10.1016/j.bpj.2012.06.035
High density waves of the bacterium Pseudomonas aeruginosa in propagating swarms result in efficient colonization of surfaces
Abstract
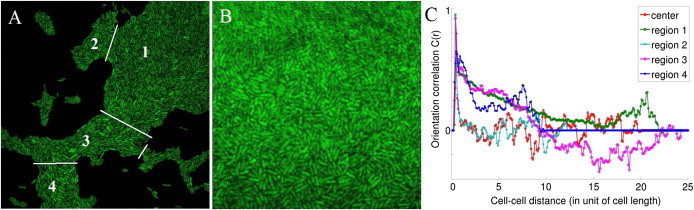
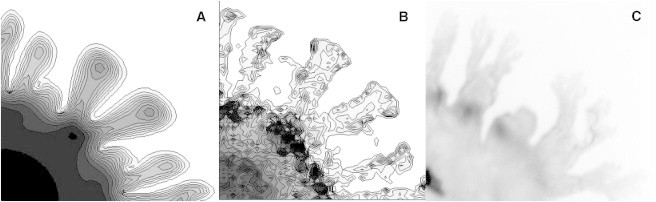
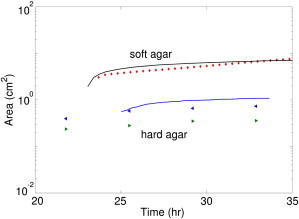
This work describes a new, to our knowledge, strategy of efficient colonization and community development where bacteria substantially alter their physical environment. Many bacteria move in groups, in a mode described as swarming, to colonize surfaces and form biofilms to survive external stresses, including exposure to antibiotics. One such bacterium is Pseudomonas aeruginosa, which is an opportunistic pathogen responsible for both acute and persistent infections in susceptible individuals, as exampled by those for burn victims and people with cystic fibrosis. Pseudomonas aeruginosa often, but not always, forms branched tendril patterns during swarming; this phenomena occurs only when bacteria produce rhamnolipid, which is regulated by population-dependent signaling called quorum sensing. The experimental results of this work show that P. aeruginosa cells propagate as high density waves that move symmetrically as rings within swarms toward the extending tendrils. Biologically justified cell-based multiscale model simulations suggest a mechanism of wave propagation as well as a branched tendril formation at the edge of the population that depends upon competition between the changing viscosity of the bacterial liquid suspension and the liquid film boundary expansion caused by Marangoni forces. Therefore, P. aeruginosa efficiently colonizes surfaces by controlling the physical forces responsible for expansion of thin liquid film and by propagating toward the tendril tips. The model predictions of wave speed and swarm expansion rate as well as cell alignment in tendrils were confirmed experimentally. The study results suggest that P. aeruginosa responds to environmental cues on a very short timescale by actively exploiting local physical phenomena to develop communities and efficiently colonize new surfaces.
Copyright © 2012 Biophysical Society. Published by Elsevier Inc. All rights reserved.
Figures
Similar articles
-
Swarming of P. aeruginosa: Through the lens of biophysics.Biophys Rev (Melville). 2023 Sep;4(3):031305. doi: 10.1063/5.0128140. Epub 2023 Sep 28. Biophys Rev (Melville). 2023. PMID: 37781002 Free PMC article. Review.
-
Surface hardness impairment of quorum sensing and swarming for Pseudomonas aeruginosa.PLoS One. 2011;6(6):e20888. doi: 10.1371/journal.pone.0020888. Epub 2011 Jun 7. PLoS One. 2011. PMID: 21687741 Free PMC article.
-
Gene expression in Pseudomonas aeruginosa swarming motility.BMC Genomics. 2010 Oct 20;11:587. doi: 10.1186/1471-2164-11-587. BMC Genomics. 2010. PMID: 20961425 Free PMC article.
-
Population dynamics during swarming of Pseudomonas aeruginosa.Commun Integr Biol. 2011 Nov 1;4(6):689-91. doi: 10.4161/cib.17109. Commun Integr Biol. 2011. PMID: 22446528 Free PMC article.
-
Risk assessment of Pseudomonas aeruginosa in water.Rev Environ Contam Toxicol. 2009;201:71-115. doi: 10.1007/978-1-4419-0032-6_3. Rev Environ Contam Toxicol. 2009. PMID: 19484589 Review.
Cited by
-
Active interface bulging in Bacillus subtilis swarms promotes self-assembly and biofilm formation.Proc Natl Acad Sci U S A. 2024 Jul 30;121(31):e2322025121. doi: 10.1073/pnas.2322025121. Epub 2024 Jul 25. Proc Natl Acad Sci U S A. 2024. PMID: 39052827 Free PMC article.
-
Swarming of P. aeruginosa: Through the lens of biophysics.Biophys Rev (Melville). 2023 Sep;4(3):031305. doi: 10.1063/5.0128140. Epub 2023 Sep 28. Biophys Rev (Melville). 2023. PMID: 37781002 Free PMC article. Review.
-
Influence of Physical Effects on the Swarming Motility of Pseudomonas aeruginosa.Biophys J. 2017 Apr 11;112(7):1462-1471. doi: 10.1016/j.bpj.2017.02.019. Biophys J. 2017. PMID: 28402888 Free PMC article.
-
Shelter in a Swarm.J Mol Biol. 2015 Nov 20;427(23):3683-94. doi: 10.1016/j.jmb.2015.07.025. Epub 2015 Aug 12. J Mol Biol. 2015. PMID: 26277623 Free PMC article. Review.
-
Self-organized canals enable long-range directed material transport in bacterial communities.Elife. 2022 Sep 26;11:e79780. doi: 10.7554/eLife.79780. Elife. 2022. PMID: 36154945 Free PMC article.
References
-
- Shrout J.D., Chopp D.L., Parsek M.R. The impact of quorum sensing and swarming motility on Pseudomonas aeruginosa biofilm formation is nutritionally conditional. Mol. Microbiol. 2006;62:1264–1277. - PubMed
-
- Jarrell K.F., McBride M.J. The surprisingly diverse ways that prokaryotes move. Nat. Rev. Microbiol. 2008;6:466–476. - PubMed
Publication types
MeSH terms
Grants and funding
LinkOut - more resources
Full Text Sources
Molecular Biology Databases
