. 2012 Aug 22;103(4):640-8.
doi: 10.1016/j.bpj.2012.07.023.

Decoupling substrate stiffness, spread area, and micropost density: a close spatial relationship between traction forces and focal adhesions

Affiliations

Decoupling substrate stiffness, spread area, and micropost density: a close spatial relationship between traction forces and focal adhesions

Sangyoon J Han et al. Biophys J. .

Abstract

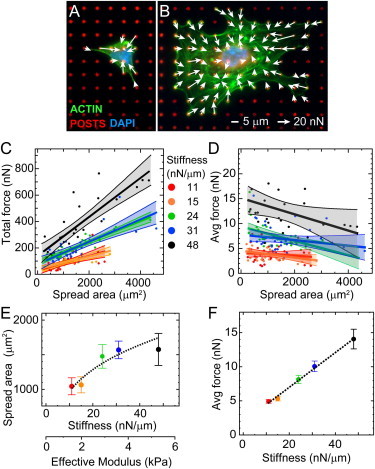
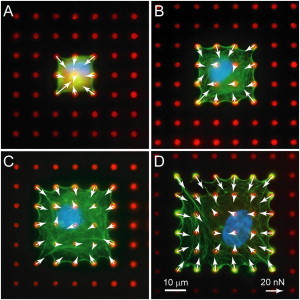
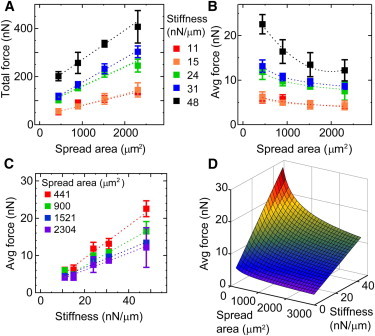
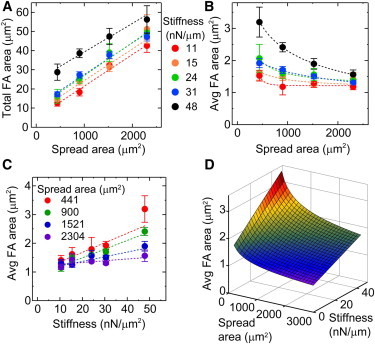
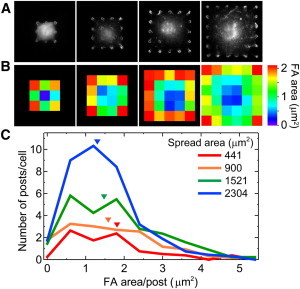
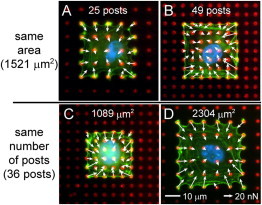
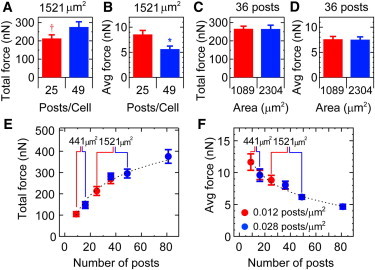
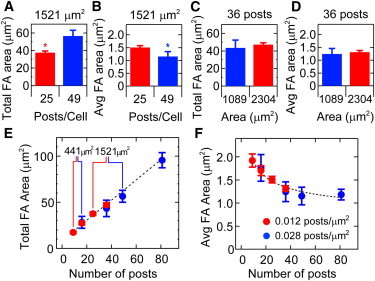
Mechanical cues can influence the manner in which cells generate traction forces and form focal adhesions. The stiffness of a cell's substrate and the available area on which it can spread can influence its generation of traction forces, but to what extent these factors are intertwined is unclear. In this study, we used microcontact printing and micropost arrays to control cell spreading, substrate stiffness, and post density to assess their effect on traction forces and focal adhesions. We find that both the spread area and the substrate stiffness influence traction forces in an independent manner, but these factors have opposite effects: cells on stiffer substrates produce higher average forces, whereas cells with larger spread areas generate lower average forces. We show that post density influences the generation of traction forces in a manner that is more dominant than the effect of spread area. Additionally, we observe that focal adhesions respond to spread area, substrate stiffness, and post density in a manner that closely matches the trends seen for traction forces. This work supports the notion that traction forces and focal adhesions have a close relationship in their response to mechanical cues.


Figures

Figure 1
Figure 1
Traction forces of HPAECs versus spread area and substrate stiffness. (Color online) (A and B) Representative fluorescent micrographs and traction forces are shown for HPAECs on arrays of microposts with a spring constant of (A) k = 24 nN/μm and (B) k = 48 nN/μm (blue: DNA; green: actin; red: microposts). Traction forces were measured by analyzing the deflections of the posts, and reported as a force vector (arrows). (C) Total force increases with spread area for HPAECs on arrays with different post stiffness. (D) Average forces decrease with spread area. Each data point represents measurement from an individual HPAEC. Straight colored lines denote the linear least-squares fits to the data, and shaded regions report the 90% confidence interval for each fit. (E) Spread area versus substrate stiffness follows a power-law relationship (dashed line). (F) Average force versus substrate stiffness has a positive linear relationship (dashed line).
Figure 2
Figure 2
Microcontact printing was used to confine the spread area of HPAECs. (Color online) Representative micrographs and traction forces of HPAECs on printed areas of (A) 441 μm2, (B) 900 μm2, (C) 1521 μm2, and (D) 2304 μm2 (blue: DNA; green: actin; red: microposts).
Figure 3
Figure 3
Spread area and post stiffness influence traction forces independently. (Color online) (A) Total force increases with spread area for HPAECs on each array type. (B) Average force decreases with spread area for each array stiffness. (C) Average force increases with substrate stiffness for each patterned area. Table S5 shows the number of HPAECs that were measured per condition and the R2 values of the best-fit lines. (D) A multiparameter fit of the data for average force shows they are a function of both spread area and stiffness. Table 1 shows the fit coefficient for nonlinear regression analysis.
Figure 4
Figure 4
Spatial distribution of traction forces determines the total force and average force for an HPAEC. (Color online) (A) Color map of average traction force at each post underneath HPAECs on 441, 900, 1521, and 2304 μm2 printed areas. High traction forces are found at the edges and corners of HPAECs. (B) Histogram of traction forces for HPAECs on each patterned area. The area under the histogram curve is equivalent to the total force of an average cell. Inverted triangles indicate average force for the data.
Figure 5
Figure 5
Spread area and post stiffness influence focal adhesion area independently. (Color online) (A) Total focal adhesion area increases with spread area. (B) Average focal adhesion area decreases with spread area. (C) Average focal adhesion area increases with substrate stiffness. Table S10 and Table S11 show R2 values of the best-fit lines. (D) A multiparameter fit of the data for average focal adhesion areas shows that they are a function of both spread area and stiffness. Table S12 shows the fit coefficient for the nonlinear regression analysis.
Figure 6
Figure 6
Focal adhesions are large at the corners and edges of an HPAEC, but small in its interior. (Color online) (A) Vinculin images of HPAECs on each pattern area. (B) Color map of average focal adhesion area. (C) Histogram of focal adhesion area per post for HPAECs on patterned areas. The area under the histogram curve is equivalent to the total focal adhesion area of an average cell. Inverted triangles indicate average focal adhesion area for the data.
Figure 7
Figure 7
Representative immunofluorescence images and force vectors of HPAECs with spread areas of 1521 μm2 and occupying (A) 25 posts or (B) 49 posts, and HPAECs occupying 36 posts and with (C) 1089 μm2 or (D) 2304 μm2 area. (blue: DNA; green: actin; red: microposts; color online).
Figure 8
Figure 8
Traction forces depend on post density rather than spread area. (Color online) For HPAECs with similar spread area, (A) total forces increase with post density and (B) average forces decrease with post density (p < 0.08, p < 0.005). (C) Total force and (D) average force are similar for HPAECs occupying the same number of posts but with different areas. (E) Total force increases logarithmically with the number of posts that an HPAEC occupies (R2 = 0.99). (F) Average force per post decreases according to a power-law fit with the number of posts underneath a cell (R2 = 0.92).
Figure 9
Figure 9
Focal adhesion area depends on the post density rather than the spread area. (Color online) For HPAECs with similar spread areas, (A) the total focal adhesion area increases with post density and (B) the average focal adhesion area decreases with post density (p < 0.05). (C) The total focal adhesion area and (D) average focal adhesion area are similar for HPAECs occupying the same number of posts but with different area. (E) The total focal adhesion area increases linearly with the number of posts occupied by a cell (R2 = 0.91). (F) The average focal adhesion area decreases according to a power-law fit with the number of posts underneath a cell (R2 = 0.92).

References

    1. Discher D.E., Janmey P., Wang Y.L. Tissue cells feel and respond to the stiffness of their substrate. Science. 2005;310:1139–1143. - PubMed
    1. Vogel V., Sheetz M. Local force and geometry sensing regulate cell functions. Nat. Rev. Mol. Cell Biol. 2006;7:265–275. - PubMed
    1. Chen C.S. Mechanotransduction—a field pulling together? J. Cell Sci. 2008;121:3285–3292. - PubMed
    1. Geiger B., Spatz J.P., Bershadsky A.D. Environmental sensing through focal adhesions. Nat. Rev. Mol. Cell Biol. 2009;10:21–33. - PubMed
    1. Schwartz M.A. Integrins and extracellular matrix in mechanotransduction. Cold Spring Harb. Perspect. Biol. 2010;2:a005066. - PMC - PubMed

Publication types

LinkOut - more resources