Comparative Study
. 2012 Aug 22;103(4):677-88.
doi: 10.1016/j.bpj.2012.07.032.

Kinetic comparisons of heart and kidney Na+,K(+)-ATPases

Affiliations
Comparative Study

Kinetic comparisons of heart and kidney Na+,K(+)-ATPases

Alvaro Garcia et al. Biophys J. .

Erratum in

  • Biophys J. 2013 Mar 5;104(5):1214

Abstract

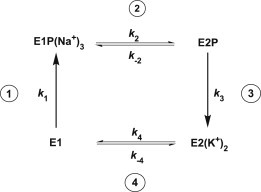
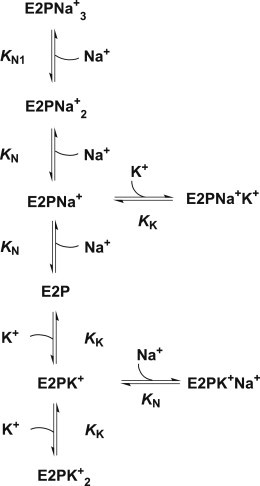
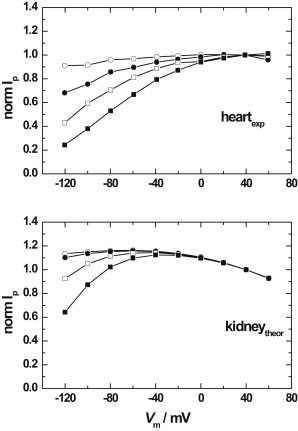
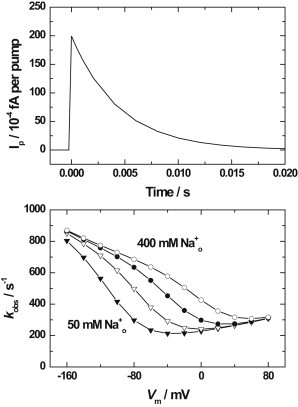
Most kinetic measurements of the partial reactions of Na(+),K(+)-ATPase have been conducted on enzyme from mammalian kidney. Here we present a kinetic model that is based on the available equilibrium and kinetic parameters of purified kidney enzyme, and allows predictions of its steady-state turnover and pump current in intact cells as a function of ion and ATP concentrations and the membrane voltage. Using this model, we calculated the expected dependence of the pump current on voltage and extracellular Na(+) concentration. The simulations indicate a lower voltage dependence at negative potentials of the kidney enzyme in comparison with heart muscle Na(+),K(+)-ATPase, in agreement with experimental results. The voltage dependence is enhanced at high extracellular Na(+) concentrations. This effect can be explained by a voltage-dependent depopulation of extracellular K(+) ion binding sites on the E2P state and an increase in the proportion of enzyme in the E1P(Na(+))(3) state in the steady state. This causes a decrease in the effective rate constant for occlusion of K(+) by the E2P state and hence a drop in turnover. Around a membrane potential of zero, negligible voltage dependence is observed because the voltage-independent E2(K(+))(2) → E1 + 2K(+) transition is the major rate-determining step.


Figures

Figure 1
Figure 1
Simplified representation of the Albers-Post scheme describing the Na+,K+-ATPase catalytic cycle. Step 1: Binding of three Na+ ions from the cytoplasm, phosphorylation by ATP, and occlusion of Na+ within the protein. Step 2: Conformational change of the phosphorylated protein releasing the Na+ ions to the extracellular medium. Step 3: Binding of two K+ ions from the extracellular medium, occlusion of K+ within the protein, and dephosphorylation. Step 4: Conformational change of the unphosphorylated protein releasing K+ ions to the cytoplasm.
Figure 2
Figure 2
Scheme describing the coupled equilibria of Na+ and K+ binding to the E2P conformation of the enzyme. The model assumes competition between Na+ and K+ at two of the transport sites with dissociation constants KN and KK, respectively, and one specific Na+ transport site with a dissociation constant KN1.
Figure 3
Figure 3
Dependence of the Na+,K+-ATPase current-voltage relationship (I/V curve) on the extracellular Na+ concentration. Symbols correspond to the following Na+ concentrations: 1.5 mM (○), 50 mM (●), 100 mM (□), and 150 mM (■). The solid lines between the points have simply been drawn to aid the eye of the reader. Upper curve: Experimental results for guinea pig heart ventricular myocytes, obtained via the whole-cell patch-clamp technique, reproduced from Fig. 3 of Nakao and Gadsby (19). The pump current, Ip, of each curve has been normalized to the value obtained at a holding potential of + 40 mV. The experimental conditions were [Na+]cyt = 50 mM, [K+]cyt = 0 mM, [K+]ext = 5.4 mM, [ATP]cyt = 10 mM, T = 36°C. Lower curve: Computer simulations of the expected I/V curve for mammalian kidney Na+,K+-ATPase pump current based on the kinetic and equilibrium parameters given in Table 1 and the Albers-Post scheme described by Figs. 1 and 2. The ion concentrations, ATP concentration, and temperature used for the simulations were the same as for the upper curve.
Figure 4
Figure 4
Simulation of a voltage-jump transient. The initial conditions were [Na+]cyt = 80 mM, [Na+]ext = 25 mM, [K+]cyt = [K+]ext = 0 mM, [ATP]cyt = 5 mM, Vm = −120 mV, T = 22°C, as in the experiments of Gadsby et al. (30). At time = 0, the membrane voltage was jumped to 0 mV. The current transient is attributed to the voltage-dependent release of Na+ from the E2P state, which is rate-limited by the E1P(Na+)3 → E2PNa+3 transition.
Figure 5
Figure 5
Simulations of the time courses of the relative populations of the Na+,K+-ATPase in the conformational states E1, E2, E1P, and E2P after a jump in the cytoplasmic Na+ concentration from 15 to 150 mM. All other conditions ([Na+]ext = 140 mM, [K+]cyt = 120 mM, [K+]ext = 4 mM, [ATP]cyt = 3 mM, Vm = −80 mV, T = 24°C) were held constant. The simulations were based on the kinetic and equilibrium parameters given in Table 1.

References

    1. Jørgensen P.L. Purification and characterization of (Na+ + K+ )-ATPase. 3. Purification from the outer medulla of mammalian kidney after selective removal of membrane components by sodium dodecylsulphate. Biochim. Biophys. Acta. 1974;356:36–52. - PubMed
    1. Jørgensen P.L. Isolation of (Na+ + K+)-ATPase. Methods Enzymol. 1974;32:277–290. - PubMed
    1. Glynn I.M. The Na+,K+-transporting adenosine triphosphatase. In: Martonosi A.N., editor. 2nd ed. Vol. 3. Plenum; New York: 1985. pp. 35–114. (The Enzymes of Biological Membranes).
    1. Sachs J.R. Cation fluxes in the red blood cell: Na+,K+ pump. Methods Enzymol. 1989;173:80–93. - PubMed
    1. Kaplan J.H. Ion movements through the sodium pump. Annu. Rev. Physiol. 1985;47:535–544. - PubMed

Publication types

LinkOut - more resources