. 2012 Nov 2;287(45):37628-46.
doi: 10.1074/jbc.M112.375832. Epub 2012 Sep 4.

HCN1 and HCN2 proteins are expressed in cochlear hair cells: HCN1 can form a ternary complex with protocadherin 15 CD3 and F-actin-binding filamin A or can interact with HCN2

Affiliations

HCN1 and HCN2 proteins are expressed in cochlear hair cells: HCN1 can form a ternary complex with protocadherin 15 CD3 and F-actin-binding filamin A or can interact with HCN2

Neeliyath A Ramakrishnan et al. J Biol Chem. .

Abstract

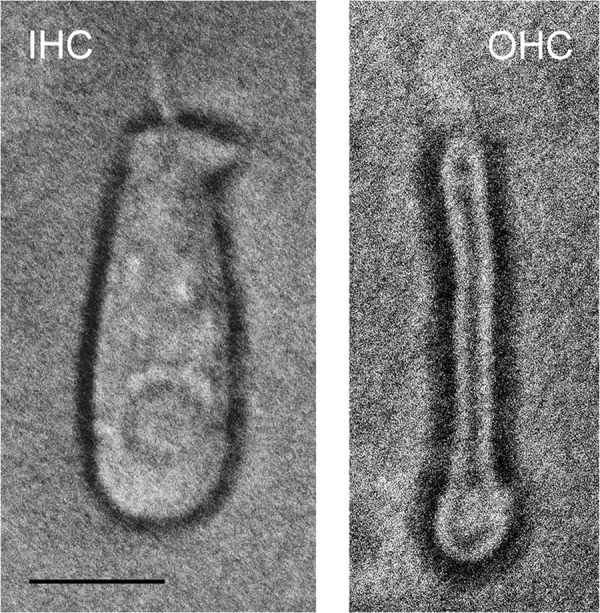
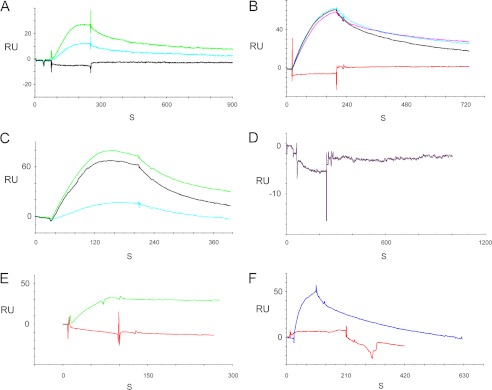
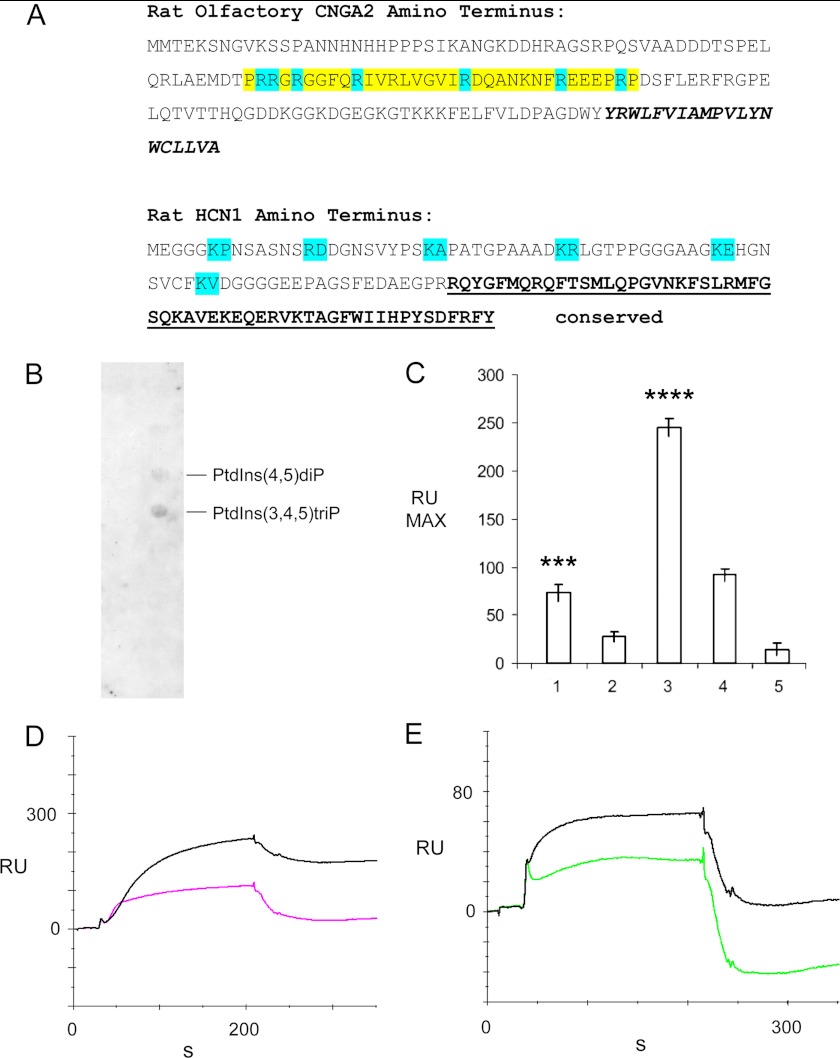
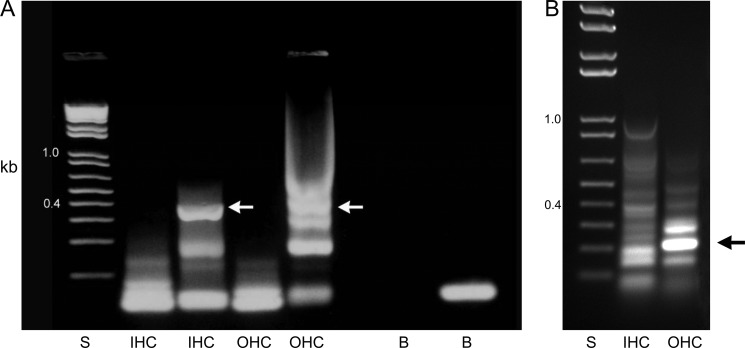
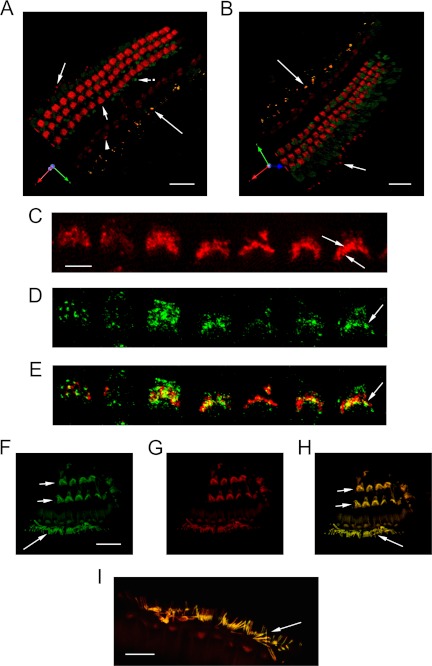
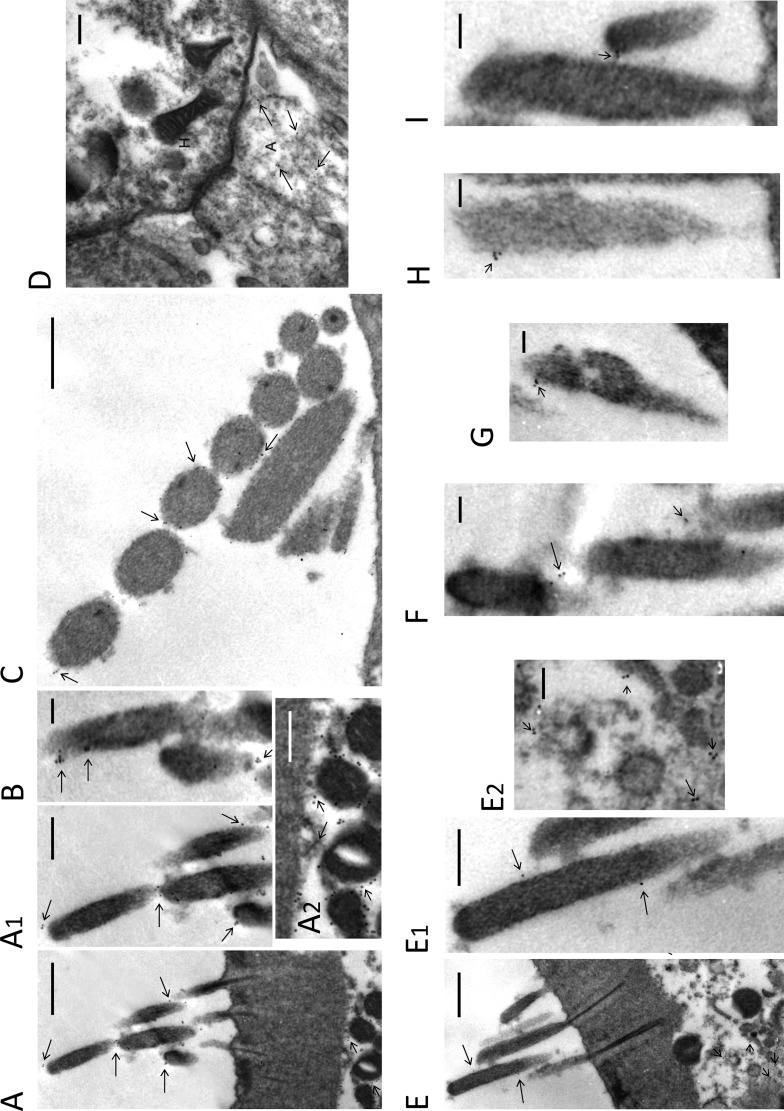
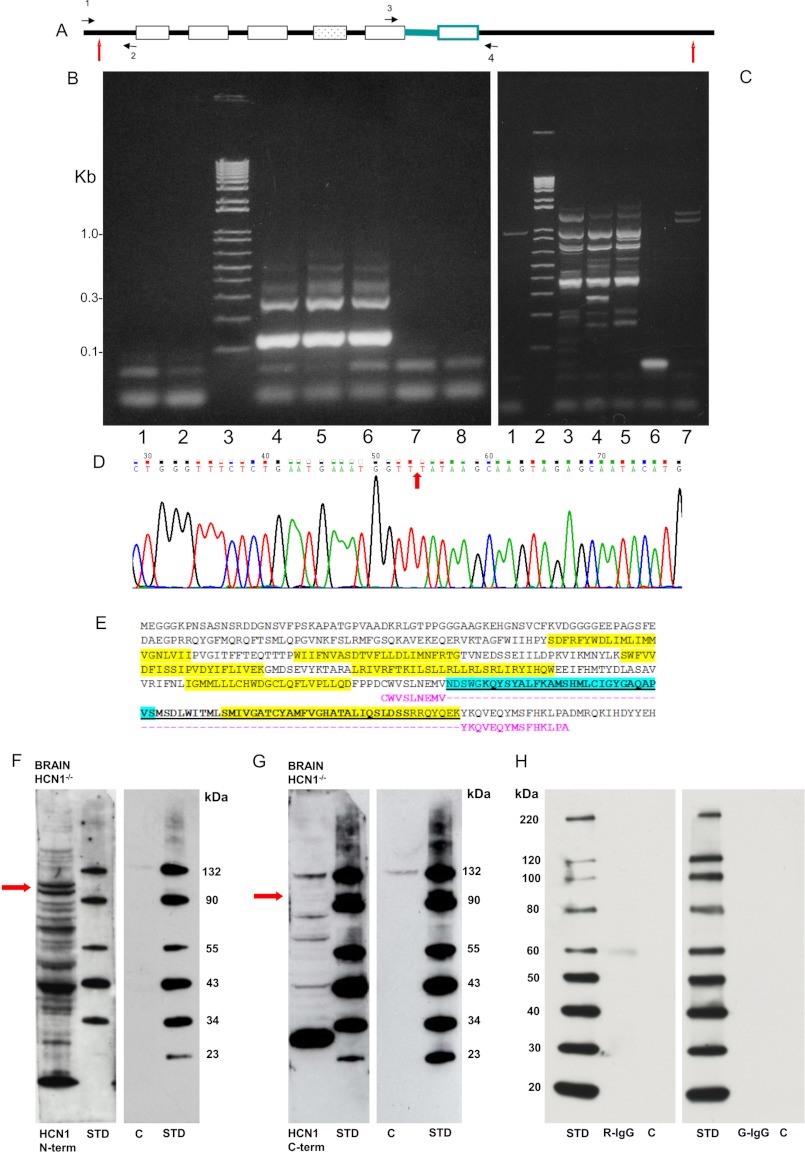
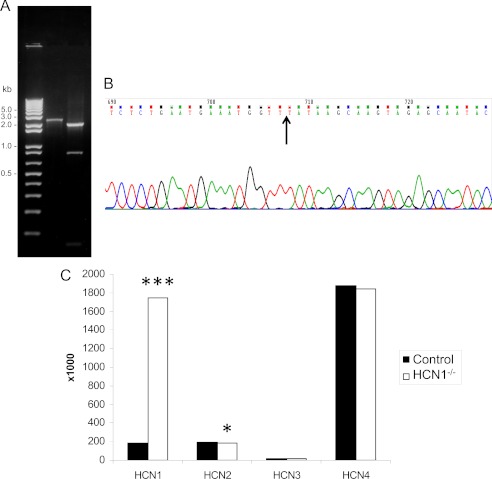
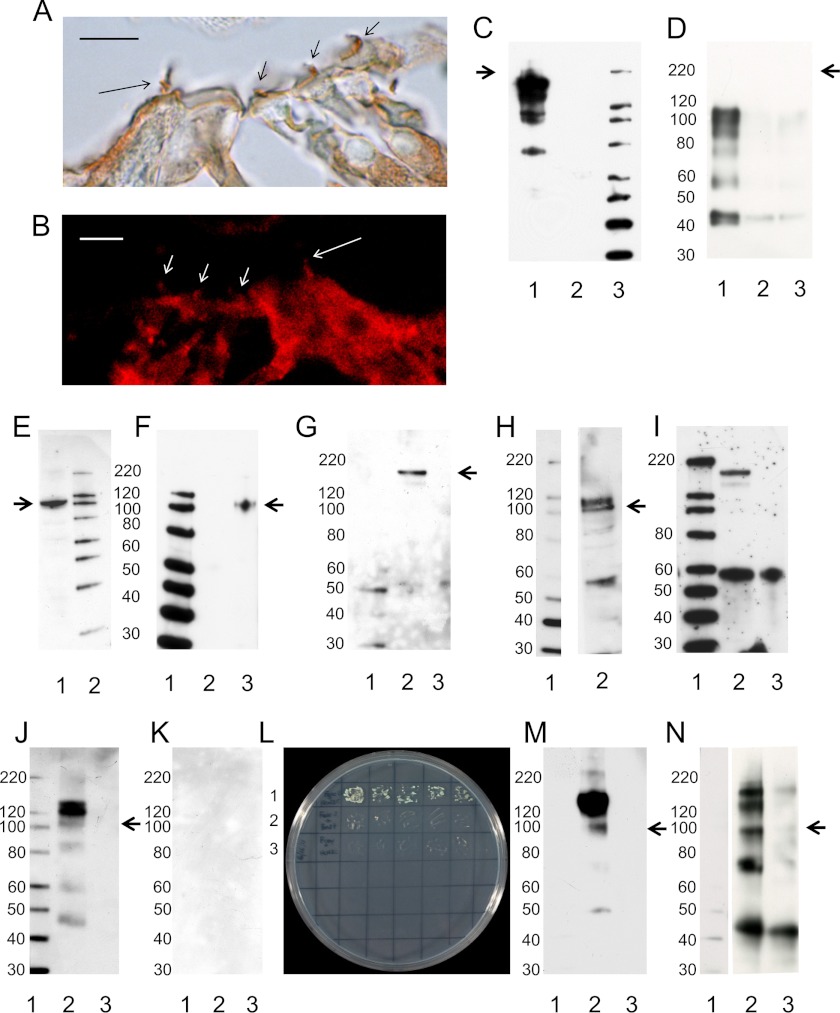
A unique coupling between HCN1 and stereociliary tip-link protein protocadherin 15 has been described for a teleost vestibular hair-cell model and mammalian organ of Corti (OC) (Ramakrishnan, N. A., Drescher, M. J., Barretto, R. L., Beisel, K. W., Hatfield, J. S., and Drescher, D. G. (2009) J. Biol. Chem. 284, 3227-3238). We now show that Ca(2+)-dependent interaction of the organ of Corti HCN1 and protocadherin 15 CD3 is mediated by amino-terminal sequence specific to HCN1 and is not replicated by analogous specific peptides for HCN2 or HCN4 nor by amino-terminal sequence conserved across HCN isoforms utilized in channel formation. Furthermore, the HCN1-specific peptide binds both phosphatidylinositol (3,4,5)-trisphosphate and phosphatidylinositol (4,5)-bisphosphate but not phosphatidylinositol 4-phosphate. Singly isolated cochlear inner and outer hair cells express HCN1 transcript, and HCN1 and HCN2 protein is immunolocalized to hair-cell stereocilia by both z-stack confocal and pre-embedding EM immunogold microscopy, with stereociliary tip-link and subcuticular plate sites. Quantitative PCR indicates HCN1/HCN2/HCN3/HCN4 = 9:9:1:89 in OC of the wild-type mouse, with HCN4 protein primarily attributable to inner sulcus cells. A mutant form of HCN1 mRNA and protein is expressed in the OC of an HCN1 mutant, corresponding to a full-length sequence with the in-frame deletion of pore-S6 domains, predicted by construct. The mutant transcript of HCN1 is ∼9-fold elevated relative to wild-type levels, possibly representing molecular compensation, with unsubstantial changes in HCN2, HCN3, and HCN4. Immunoprecipitation protocols indicate alternate interactions of full-length proteins; HCN1 can interact with protocadherin 15 CD3 and F-actin-binding filamin A forming a complex that does not include HCN2, or HCN1 can interact with HCN2 forming a complex without protocadherin 15 CD3 but including F-actin-binding fascin-2.


Figures

FIGURE 1.
FIGURE 1.
Isolation of inner and outer hair cells from the adult rat organ of Corti as described in the text and microscopically observed (×200 magnification). Left panel, IHC. Right panel, OHC. Scale bar, 10 μm (IHC and OHC).
FIGURE 2.
FIGURE 2.
Molecular requirements for HCN amino terminus binding to protocadherin 15 CD3 determined with SPR for rat organ of Corti proteins. A, SPR for HCN1-specific (nonconserved) amino terminus sequence as follows: protocadherin 15 CD3 as ligand, HCN1-specific (nonconserved) amino terminus as analyte at 100 nm; 100 μm Ca2+ (light green), 1 mm EGTA (turquoise); buffer control (100 μm Ca2+, black). B, HCN1-specific amino terminus as analyte at 100 nm; 100 μm Ca2+ (pink, black, and turquoise, three repeats); buffer control (red). C, HCN1 full-length amino terminus as analyte at 100 nm; 100 μm Ca2+ (green), 26.5 μm Ca2+ (black), 1 mm EGTA (turquoise). D, conserved HCN1 amino-terminal sequence as analyte at 200 nm; 100 μm Ca2+. E, HCN2-specific amino terminus as analyte at 100 nm, 100 μm Ca2+ (red); HCN1-specific amino terminus at 100 nm, 100 μm Ca2+ (green). There is no binding of the HCN2-specific amino-terminal sequence to protocadherin 15 CD3. F, HCN4-specific (nonconserved) amino terminus as analyte at 100 nm, 100 μm Ca2+ (red); HCN1-specific (nonconserved) amino terminus as analyte at 100 nm, 100 μm Ca2+ (blue). There is no binding of HCN4 to protocadherin 15 CD3. A–F, three SPR determinations were performed for each condition/construct. (For KD values, see Table 1.) RU, response units.
FIGURE 3.
FIGURE 3.
Interaction between the HCN1-specific amino terminus with PIP3 and PIP2. A, rat olfactory CNGA2 amino terminus: residues 61–90 (highlighted in yellow) are necessary for PIP3 binding and suppression of CNG channel currents (arginine residues putatively used in CNGA2 binding to PIP3 are highlighted in blue). Bold italicized sequence is first membrane spanning region. Rat HCN1 amino terminus: positively charged aa residues putatively involved in lipid binding are highlighted in blue. HCN1 amino terminus: sequence that is conserved across HCN isoforms is boldface and underlined. B, membrane lipid strip analysis of binding to the specific, nonconserved amino terminus of rat HCN1. Of the 16 lipid components, binding was observed for PIP3 and PIP2. C, SPR for interaction of HCN1 and phospholipids is as follows: bar 1, PIP2 + Ca2+; bar 2, PIP2 + EGTA; bar 3, PIP3 + Ca2+; bar 4, PIP3 + EGTA; bar 5, buffer; means ± S.E. are indicated. ***, PIP2 + Ca2+ versus PIP2 + EGTA, p < 0.01; ****, PIP3 + Ca2+ versus PIP3 + EGTA, p < 0.001 (two-tailed t test for difference of means for small samples, n = 5). The cytoplasmic amino terminus of rat HCN1 was expressed and purified as a histidine-tagged fusion peptide and used as ligand in surface plasmon resonance analysis on a CM5 sensor chip. 10 μm of each phosphatidylinositol served as analyte in either 92 μm Ca2+ or 1 mm EGTA. Three experiments were carried out, each with n = 5, yielding similar results. D, representative sensorgrams showing interaction of rat HCN1-specific amino terminus (ligand) with PIP3 (10 μm) (analyte) in either 92 μm Ca2+ (black) or in 1 mm EGTA (pink). E, representative sensorgram illustrating interaction of PIP2 (10 μm) (analyte) in either 92 μm Ca2+ (black) or 1 mm EGTA (green) with HCN1-specific amino terminus (ligand). D and E, five SPR determinations were performed for each condition/construct per experiment, and multiple experiments were carried out. RU, response units.
FIGURE 4.
FIGURE 4.
Amplification of HCN1 and HCN2 cDNA from cochlear inner and outer hair cells. A, agarose gel for HCN1 PCR indicating amplification from the cochlear inner and outer hair cell cDNA of predicted 397-bp product crossing intron (white arrows). Nucleotide sequencing of uncloned rat HCN1 amplification product from cochlear IHC indicated 100% identity to rat HCN1. Nested primers applied in PCR to the OHC 397-bp product elicited amplification of HCN1 cDNA with 100% identity to rat HCN1 nucleotide sequence. The adjacent lanes (IHC and OHC) with a second set of primers for HCN1 yielded negative results. B, agarose gel for amplification of HCN2 cDNA from rat cochlear outer hair cells (209 bp, crossing intron, black arrow) with 100% nucleotide identity to rat HCN2. S, 1-kb standards; B, water blanks.
FIGURE 5.
FIGURE 5.
z-Stack confocal immunofluorescence analysis of HCN1 and HCN2 protein expression in the organ of Corti of the adult mouse. A and B, three-dimensional reconstruction of 43 1-μm confocal optical slices, indicating immunofluorescence (red) for HCN1 (Abcam 1:50) and HCN2 (green) (Alomone, 1:200) in the organ of Corti of the adult mouse. Immunofluorescence for HCN1 was localized to stereociliary arrays for outer hair cells, which in the reconstruction extended to subcuticular sites (A, short arrow). Immunofluorescence (red) for inner hair cell stereociliary regions was visible but more sparse (A, arrowhead). HCN2 immunoreactivity (green) co-localized with HCN1 in afferents beneath the inner hair cells (A and B, yellow, long arrows). Afferents beneath outer hair cells contained primarily immunofluorescence for HCN1 (A and B, red, medium arrows). The situation that was set up was potentially one of possible competition between HCN1 and HCN2 primary antibodies. Regions of intense immunoreactivity for HCN2 appeared adjacent to the outer hair cells, consistent in position to extensions of Deiters' cells (A, short arrow with dot). Scale bars for A and B, 20 μm. B, second position of three-dimensional reconstruction of z-stack confocal optical slices. The results were consistent with differential distribution of HCN1 and HCN2 in cells of the organ of Corti and differential expression at intracellular sites. C, 1-μm optical section 3 μm in from beginning position of the z-stack, illustrating HCN1 immunofluorescence (red, Santa Cruz Biotechnology) in cochlear outer hair cell stereociliary arrays, with arrows pointing to two individual inner rows of stereocilia in the stereociliary array. Scale bars for C–E, 4 μm. D, 1-μm optical section (paired with C), showing HCN2 immunofluorescence (green, Alomone) in OHC stereocilia (arrow). E, confocally determined overlap (yellow) of HCN1 (C) with HCN2 (D) in stereocilia of OHC (arrow). F, z-stack confocal imaging of HCN2 immunofluorescence (green) in cochlear outer hair cell stereocilia (short arrows) and inner hair cell stereocilia (medium arrow), 0.3-μm optical section (0.6 μm into z-stack) for HCN2 and phalloidin combination. Scale bars for F–H, 20 μm. G, rhodamine-coupled phalloidin detection of F-actin (red) in cochlear hair cell stereocilia. H, confocal overlap of HCN2 with phalloidin (yellow) in cochlear outer hair cell stereocilia (short arrows) and inner hair cell stereocilia (medium arrow). I, magnified view of HCN2 overlap with phalloidin in IHC stereocilia (arrow). Scale bar, 10 μm.
FIGURE 6.
FIGURE 6.
Pre-embedding immunogold detection of HCN1 and HCN2 in hair cells of the organ of Corti in the adult rat. A and B, HCN1 immunogold (Alomone antibody) is found at apical and lateral sites on stereocilia of outer hair cells (arrows) (magnified in A1) not dissimilar in position to that reported for tip-link proteins (4). Also note that HCN1 immunogold in A is concentrated at subcuticular plate sites (short arrows) of outer hair cells (magnified in A2). Scale bars, 500 nm for A; 250 nm for A1 and A2; 100 nm for B. C, HCN1 immunogold (arrows, Alomone primary antibody) is localized in IHC to filaments extending at lateral positions, possibly cross-connecting stereocilia. Scale bar, 300 nm. Magnified view is shown in supplemental Fig. 3A. D, HCN1 immunogold (arrows, Alomone primary antibody) was found in type II afferent endings (A) on OHC (H), as was observed with confocal immunofluorescence with a different HCN1 antibody (Abcam) and different rodent (mouse). Scale bar, 200 nm. Magnified view is shown in supplemental Fig. 3B; HCN2 immunogold was found at lateral positions on taller stereocilia of OHC in the adult rat (E, arrows; magnified in E1) as well as at sites at the top of shorter stereocilia (F–I, arrows). As with HCN1, immunogold for HCN2 was also found at sites beneath the cuticular plate (E, short arrows, magnified in E2), but unlike HCN1, HCN2 was not found in type II afferent dendrites at the base of OHC (not illustrated), consistent with results from confocal microscopy. Scales bars, 500 nm for E; 250 nm for E1; 100 nm for E2, and F–I.
FIGURE 7.
FIGURE 7.
Expression of transcript and protein in the HCN1 mutant, HCN1−/− (8). A, diagrammatic representation of HCN1 with primer positions for RT-PCR amplification of the amino-terminal cDNA indicated by black arrows 1 and 2 (upstream primer gggatggctgtcttcagttcctg; downstream primer ccacaagttaccagctgaca, Δ379 bp). Black arrows 3 and 4 designate primers encompassing the pore and S6 transmembrane domains (upstream primer atggaaggcggcggcaaacccaa; downstream primer gcaggcttctggattatccatccg, Δ120 bp). Amino- and carboxyl-terminal positions of HCN1 amino acid sequence targeted by primary antibodies in Western blots (Fig. 8, F and G) are indicated by red vertical arrows, respectively. B, agarose gel separation of cDNA products amplified from brain cDNA of the HCN1−/− mutant mouse with primers situated in front and back of the in-frame deletion of the pore filter + S6 transmembrane domain. Lanes 1 and 2 are water blanks; lane 3, standards; lanes 4–6 replicates with predicted 120-bp products; lanes 7 and 8, −RTs). C, agarose gel separation of cDNA amplified (379 bp) from brain of HCN1−/− for full amino terminus of HCN1; lane 1, −RT; lane 2, standards; lanes 3–5, three separate + RT preparations; lane 6, water blank; and lane 7, −RT. D, arrow shows splice location between exons 3 and 5 (exon 4 is deleted in the knock-out) in contiguous nucleotide sequence of HCN1 in brain cDNA for HCN1−/− mutant. E, HCN1 wild-type amino acid sequence is presented. Transmembrane regions are highlighted in yellow. The underlined sequence, including exon 4 (boldface), is deleted in HCN1−/−. The pore is highlighted in blue; the S6 transmembrane region (underlined) is highlighted in yellow. Contiguous amino acid sequence in HCN1−/− is in pink. F and G, Western blots demonstrating protein fragments of HCN1 remaining in brain (35-μg quantities) of HCN1−/− as determined by the HCN1 amino-terminal targeting antibody (F, Alomone primary antibody raised in rabbit) and HCN1 carboxyl-terminal targeting antibody (G, Santa Cruz Biotechnology primary antibody raised in goat), evidence of full-length protein translation minus the pore + S6. Red arrows show doublet bands, present in both blots, representing longest fragments consistent with predicted mass for HCN1 in HCN1−/− mutant of 93.6 kDa (lower band) and presumably a glycosylated version (10) (upper band). H, IgG negative controls, left panel, Western blots of HCN1−/− brain lysate probed with equivalent amounts of rabbit IgG (R-IgG) as used in F, and right panel, equivalent goat IgG (G-IgG) as used in G. For F–H, C = Western negative control with brain lysate, secondary antibody, but no primary antibody. STD = standards.
FIGURE 8.
FIGURE 8.
Quantitative PCR analysis of HCN isoform expression in organ of Corti of adult mouse for wild type and HCN1−/−. A, agarose gel resolution of PCR product for full-length HCN1 cDNA in organ of Corti for control (lane 2, predicted Δ = 2,363 bp) versus mutant (lane 3, predicted Δ = 2,144 bp), demonstrating full-length sequence in mutant with the in-frame deletion. B, nucleotide sequence for organ of Corti HCN1 in the HCN1−/−, demonstrating again, as for brain, contiguous mRNA sequence before and after the in-frame deletion of the pore filter and sixth trans-membrane region. Arrow shows splice location between exons 3 and 5 (exon 4 is deleted in the mutant). C, quantitative PCR for HCN isoforms in morphologically defined mouse cochlear organ of Corti subfraction (6) for HCN1−/− versus control. *** indicates p = 0.0026 for HCN1 in HCN1 mutant versus control ΔCt by unpaired, two-tailed t test. * indicates p = 0.054 for HCN2 in HCN1 mutant versus control. Five sets of experiments each with two replicates per point.
FIGURE 9.
FIGURE 9.
Immunoprecipitation by primary antibodies to filamin A, HCN2, and fascin-2. Immunoreactivity for filamin A detected by DAB (A) and immunofluorescence (B) (mouse MAB1678 raised to human filamin A crossing to rat; 1:1,000, clone PM6/317, Chemicon) was localized to stereocilia of both inner hair cells (long arrows) and outer hair cells (short arrows) in rat cochlea. Scale bars for A and B, 10 μm. C, lane 1, full-length filamin A (detected with filamin A primary antibody 1:1,000) in immunoprecipitation complex arising from the use of anti-filamin A for immunoprecipitation (1:100) from rat brain lysate. This antibody recognizes unprocessed filamin A (270–280 kDa, arrow, as well as 170-, 150-, and 120-kDa cleavage fragments (Chemicon)). Lane 2, negative control with brain lysate, without anti-filamin A immunoprecipitation + beads + primary and secondary antibodies; lane 3, standards. D, additional negative control for C. Immunoprecipitation with mouse IgG as negative control probed with antifilamin A. Lane 1, mouse IgG immunoprecipitation of brain lysate + beads, probed with filamin A primary + donkey anti-mouse secondary. Lane 2, mouse IgG (no immunoprecipitation) + beads, probed with filamin A primary + donkey anti-mouse secondary. Lane 3, denatured mouse IgG electrophoresis, probed with filamin A primary + donkey anti-mouse secondary. No protein was observed corresponding to molecular mass of filamin A (arrow). E, Western blot of HCN1 (104 kDa, arrow) in rat brain lysate (1:50, sc-19706, Santa Cruz Biotechnology), lane 1; lane 2, standards. F, immunoprecipitation by anti-filamin A of full-length HCN1. Lane 1, standards; lane 2, negative control with brain lysate without anti-filamin A immunoprecipitation + beads + primary and secondary antibodies; lane 3, HCN1 immunoprecipitated with anti-filamin A (arrow, 104 kDa), detected with goat anti-mouse HCN1 (carboxyl terminus) which crosses to rat HCN1 sequence (sc-19706 Santa Cruz Biotechnology). G, complex of filamin A and HCN1 also contained protocadherin 15 CD3. Lane 1, standards; lane 2, full-length protocadherin 15 CD3 (189 kDa, arrow) immunoprecipitated with anti-filamin A detected with custom primary antibody (1:10,000) (arrow). Goat anti-chick IgY-HRP (Santa Cruz Biotechnology) was used as the secondary antibody (1:10,000). Lane 3, negative control without anti-filamin A immunoprecipitation but with brain lysate and protein A beads and primary and secondary antibodies. H, Western blot of HCN2 in rat brain lysate. Lane 1, standards; lane 2, HCN2 detected with a rabbit polyclonal antibody (1:200, Alomone). Predicted molecular masses of 95 and 127 kDa corresponding to unglycosylated (arrow) and glycosylated HCN2, respectively. I, HCN2 is not detected in the complex immunoprecipitated by anti-filamin A. Lane 1, standards; lane 2, HCN2 bands observed in Western (H) are not detected in immunoprecipitated complex. Bands at 170–180 kDa may correspond to protocadherin 15 CD3, given that 5 of 15 aa in the epitope targeted by the HCN2 antibody are identical in protocadherin 15 CD3, and further given that protocadherin 15 CD3 is highly concentrated in the complex immunoprecipitated by anti-filamin A (G). J, anti-HCN2 immunoprecipitates HCN1 from rat brain lysate. Lane 1, standards; lane 2, anti-HCN2 primary antibody (1:33, Alomone) immunoprecipitates HCN1 unglycosylated (104 kDa, arrow) and glycosylated (120 and 130 kDa) forms detected with anti-HCN1 primary antibody (Santa Cruz Biotechnology); lane 3, negative control for immunoprecipitation with all components except anti-HCN2 antibody for immunoprecipitation (brain lysate and beads). K, anti-HCN2 immunoprecipitation of HCN1 complex does not include protocadherin 15 CD3. Lane 1, standards; lane 2, anti-protocadherin 15 CD3 primary antibody (1:7,500), goat anti-chick secondary antibody (1:5,000); lane 3, negative control without anti-HCN2 antibody for immunoprecipitation (brain lysate and beads). No bands were evident for either experimental (lane 2) or negative control (lane 3) with goat anti-chick IgY as the secondary antibody. In a second protocol, a bovine anti-chick secondary antibody (1:5,000) detected an ∼170-kDa protein in both experimental and negative control (not illustrated). L, HCN2 binds to fascin-2 by yeast two-hybrid co-transformation. Row 1, HCN2 carboxyl terminus in bait vector pGBKT7 plus fascin-2 in prey vector pGADT7; row 2, negative control with fascin-2 in prey construct plus empty bait construct; row 3, negative control with HCN2 in bait construct plus empty prey construct. The co-transformation screening was performed once, and then the desired colony was re-plated onto another selection media in triplicate, with negative controls. The same concentrations of yeast were plated in the grids for rows 1-3. M, anti-fascin-2 immunoprecipitation of HCN2. Lane 1, standards; lane 2, 95 kDa (arrow) and 127-kDa bands, corresponding to unglycosylated and glycosylated HCN2, respectively; lane 3 negative control without anti-fascin 2 antibody in immunoprecipitation (brain lysate and beads). N, HCN1 is in fascin-2 immunoprecipitation complex along with HCN2. Lane 1, standards; lane 2, unglycosylated (arrow) and glycosylated forms of HCN1 at 120 kDa. Lane 3, goat IgG immunoprecipitation negative control, with beads and all components except anti-fascin-2 for immunoprecipitation. Three or more immunoprecipitation experiments were carried out for each protein in a given complex.

Similar articles

Cited by

References

    1. Cho W. J., Drescher M. J., Hatfield J. S., Bessert D. A., Skoff R. P., Drescher D. G. (2003) Hyperpolarization-activated, cyclic AMP-gated, HCN1-like cation channel. The primary, full-length HCN isoform expressed in a saccular hair-cell layer. Neuroscience 118, 525–534 - PubMed
    1. Ramakrishnan N. A., Drescher M. J., Barretto R. L., Beisel K. W., Hatfield J. S., Drescher D. G. (2009) Calcium-dependent binding of HCN1 channel protein to hair cell stereociliary tip link protein protocadherin 15 CD3. J. Biol. Chem. 284, 3227–3238 - PMC - PubMed
    1. Seiler C., Finger-Baier K. C., Rinner O., Makhankov Y. V., Schwarz H., Neuhauss S. C., Nicolson T. (2005) Duplicated genes with split functions. Independent roles of protocadherin15 orthologues in zebrafish hearing and vision. Development 132, 615–623 - PubMed
    1. Kazmierczak P., Sakaguchi H., Tokita J., Wilson-Kubalek E. M., Milligan R. A., Müller U., Kachar B. (2007) Cadherin 23 and protocadherin 15 interact to form tip-link filaments in sensory hair cells. Nature 449, 87–91 - PubMed
    1. Grati M., Kachar B. (2011) Myosin VIIa and sans localization at stereocilia upper tip-link density implicates these Usher syndrome proteins in mechanotransduction. Proc. Natl. Acad. Sci. U.S.A. 108, 11476–11481 - PMC - PubMed

Publication types

MeSH terms