

C-terminal domains of N-methyl-D-aspartic acid receptor modulate unitary channel conductance and gating
- PMID: 22948148
- PMCID: PMC3476275
- DOI: 10.1074/jbc.M112.390013
C-terminal domains of N-methyl-D-aspartic acid receptor modulate unitary channel conductance and gating
Abstract
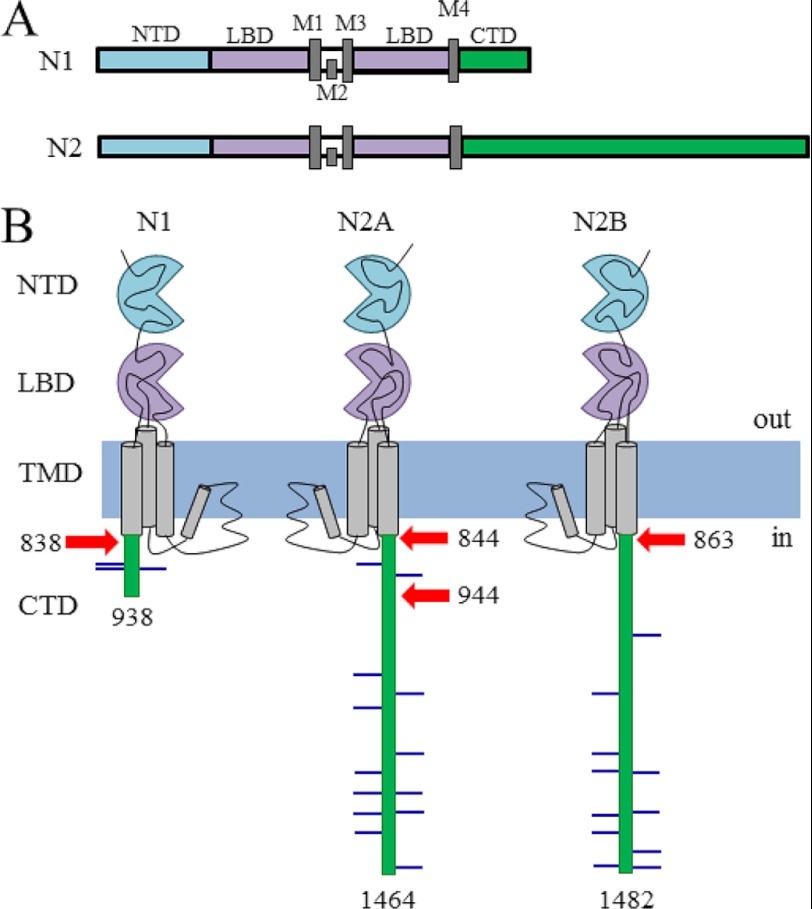
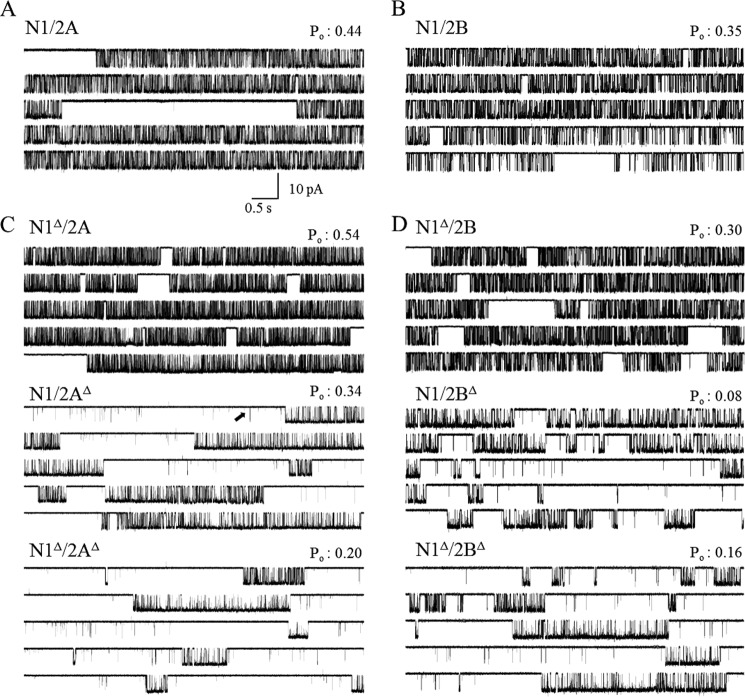
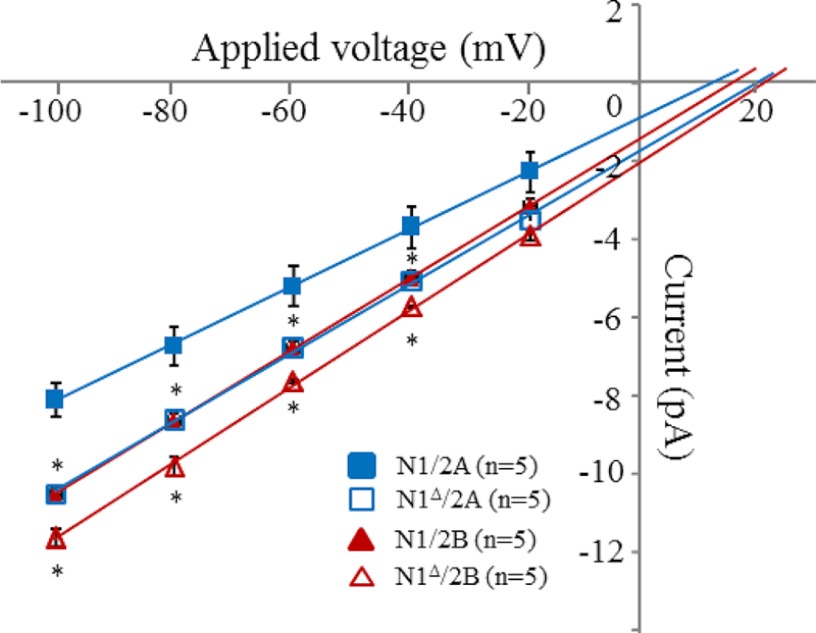
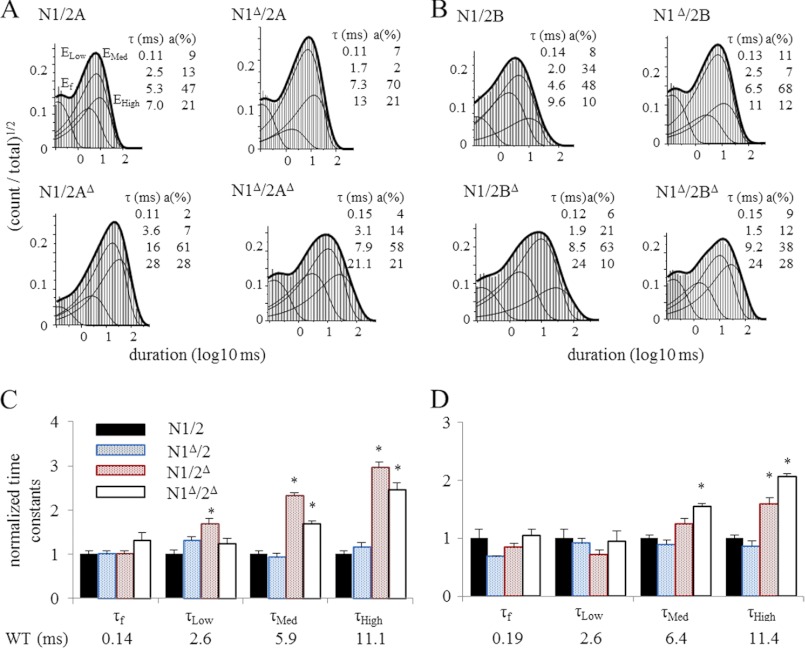
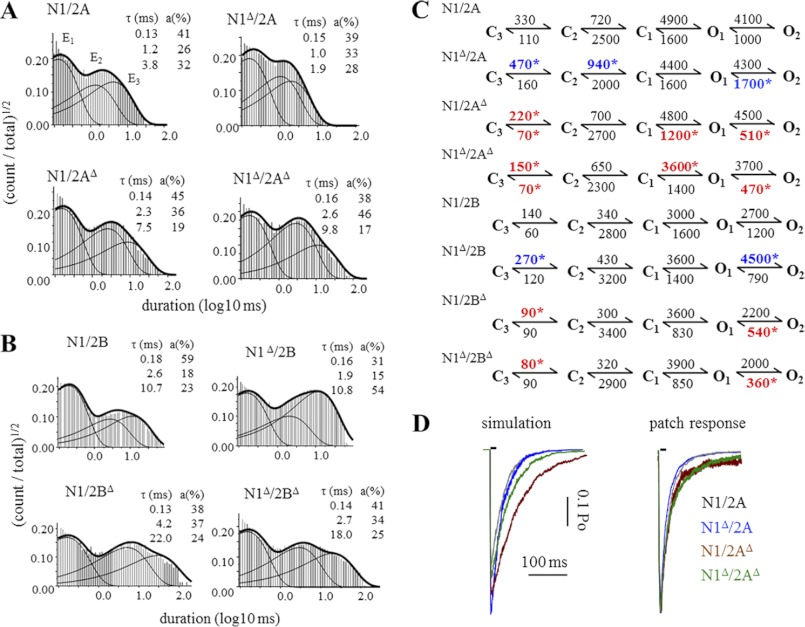
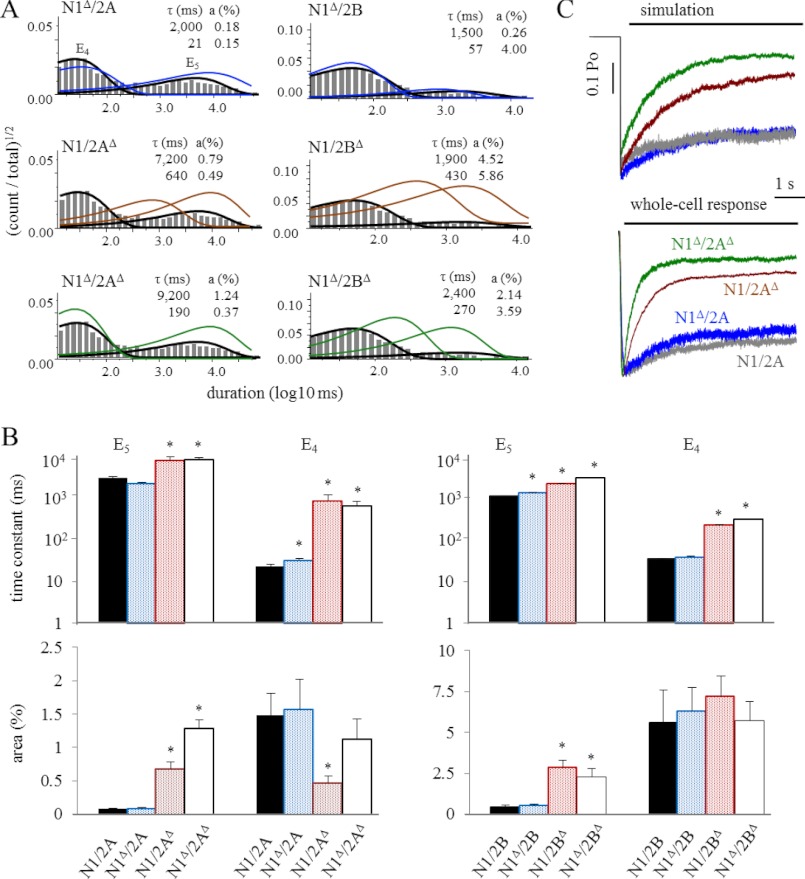
NMDA receptors (NRs) are glutamate-gated calcium-permeable channels that are essential for normal synaptic transmssion and contribute to neurodegeneration. Tetrameric proteins consist of two obligatory GluN1 (N1) and two GluN2 (N2) subunits, of which GluN2A (2A) and GluN2B (2B) are prevalent in adult brain. The intracellularly located C-terminal domains (CTDs) make a significant portion of mass of the receptors and are essential for plasticity and excitotoxicity, but their functions are incompletely defined. Recent evidence shows that truncation of the N2 CTD alters channel kinetics; however, the mechanism by which this occurs is unclear. Here we recorded activity from individual NRs lacking the CTDs of N1, 2A, or 2B and determined the gating mechanisms of these receptors. Receptors lacking the N1 CTDs had larger unitary conductance and faster deactivation kinetics, receptors lacking the 2A or 2B CTDs had longer openings and longer desensitized intervals, and the first 100 amino acids of the N2 CTD were essential for these changes. In addition, receptors lacking the CTDs of either 2A or 2B maintained isoform-specific kinetic differences and swapping CTDs between 2A and 2B had no effect on single-channel properties. Based on these results, we suggest that perturbations in the CTD can modify the NR-mediated signal in a subunit-dependent manner, in 2A these effects are most likely mediated by membrane-proximal residues, and the isoform-specific biophysical properties conferred by 2A and 2B are CTD-independent. The kinetic mechanisms we developed afford a quantitative approach to understanding how the intracellular domains of NR subunits can modulate the responses of the receptor.
Figures
Similar articles
-
Separate intramolecular targets for protein kinase A control N-methyl-D-aspartate receptor gating and Ca2+ permeability.J Biol Chem. 2014 Jul 4;289(27):18805-17. doi: 10.1074/jbc.M113.537282. Epub 2014 May 20. J Biol Chem. 2014. PMID: 24847051 Free PMC article.
-
Mechanistic and structural determinants of NMDA receptor voltage-dependent gating and slow Mg2+ unblock.J Neurosci. 2013 Feb 27;33(9):4140-50. doi: 10.1523/JNEUROSCI.3712-12.2013. J Neurosci. 2013. PMID: 23447622 Free PMC article.
-
Properties of Triheteromeric N-Methyl-d-Aspartate Receptors Containing Two Distinct GluN1 Isoforms.Mol Pharmacol. 2018 May;93(5):453-467. doi: 10.1124/mol.117.111427. Epub 2018 Feb 26. Mol Pharmacol. 2018. PMID: 29483146 Free PMC article.
-
NMDA Receptor C-Terminal Domain Signalling in Development, Maturity, and Disease.Int J Mol Sci. 2022 Sep 27;23(19):11392. doi: 10.3390/ijms231911392. Int J Mol Sci. 2022. PMID: 36232696 Free PMC article. Review.
-
Emerging issues of connexin channels: biophysics fills the gap.Q Rev Biophys. 2001 Aug;34(3):325-472. doi: 10.1017/s0033583501003705. Q Rev Biophys. 2001. PMID: 11838236 Review.
Cited by
-
NMDA Receptor Opening and Closing-Transitions of a Molecular Machine Revealed by Molecular Dynamics.Biomolecules. 2019 Sep 28;9(10):546. doi: 10.3390/biom9100546. Biomolecules. 2019. PMID: 31569344 Free PMC article.
-
Selective Cell-Surface Expression of Triheteromeric NMDA Receptors.Methods Mol Biol. 2024;2799:55-77. doi: 10.1007/978-1-0716-3830-9_5. Methods Mol Biol. 2024. PMID: 38727903 Free PMC article.
-
Analysis of Surface Expression of NMDAR Subunits in Primary Hippocampal Neurons.Methods Mol Biol. 2024;2799:29-46. doi: 10.1007/978-1-0716-3830-9_3. Methods Mol Biol. 2024. PMID: 38727901
-
From bedside-to-bench: What disease-associated variants are teaching us about the NMDA receptor.J Physiol. 2021 Jan;599(2):397-416. doi: 10.1113/JP278705. Epub 2020 Apr 9. J Physiol. 2021. PMID: 32144935 Free PMC article. Review.
-
Influence of GluN2 subunit identity on NMDA receptor function.Neuropharmacology. 2013 Nov;74:4-17. doi: 10.1016/j.neuropharm.2013.01.016. Epub 2013 Jan 31. Neuropharmacology. 2013. PMID: 23376022 Free PMC article. Review.
References
-
- Mayer M. L., Westbrook G. L., Guthrie P. B. (1984) Voltage-dependent block by Mg2+ of NMDA responses in spinal cord neurones. Nature 309, 261–263 - PubMed
-
- Nowak L., Bregestovski P., Ascher P., Herbet A., Prochiantz A. (1984) Magnesium gates glutamate-activated channels in mouse central neurones. Nature 307, 462–465 - PubMed
Publication types
MeSH terms
Substances
Grants and funding
LinkOut - more resources
Full Text Sources
Other Literature Sources
