. 2012 Oct 26;287(44):37233-44.
doi: 10.1074/jbc.M112.398974. Epub 2012 Sep 4.

Bidirectional coupling between ryanodine receptors and Ca2+ release-activated Ca2+ (CRAC) channel machinery sustains store-operated Ca2+ entry in human T lymphocytes

Affiliations

Bidirectional coupling between ryanodine receptors and Ca2+ release-activated Ca2+ (CRAC) channel machinery sustains store-operated Ca2+ entry in human T lymphocytes

Pratima Thakur et al. J Biol Chem. .

Abstract

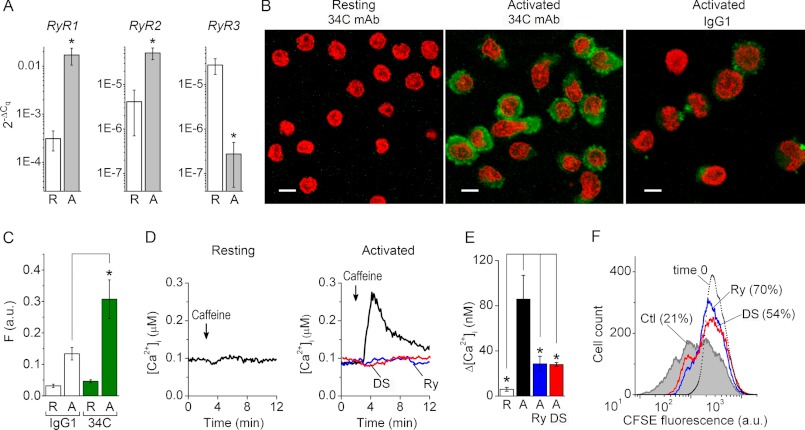
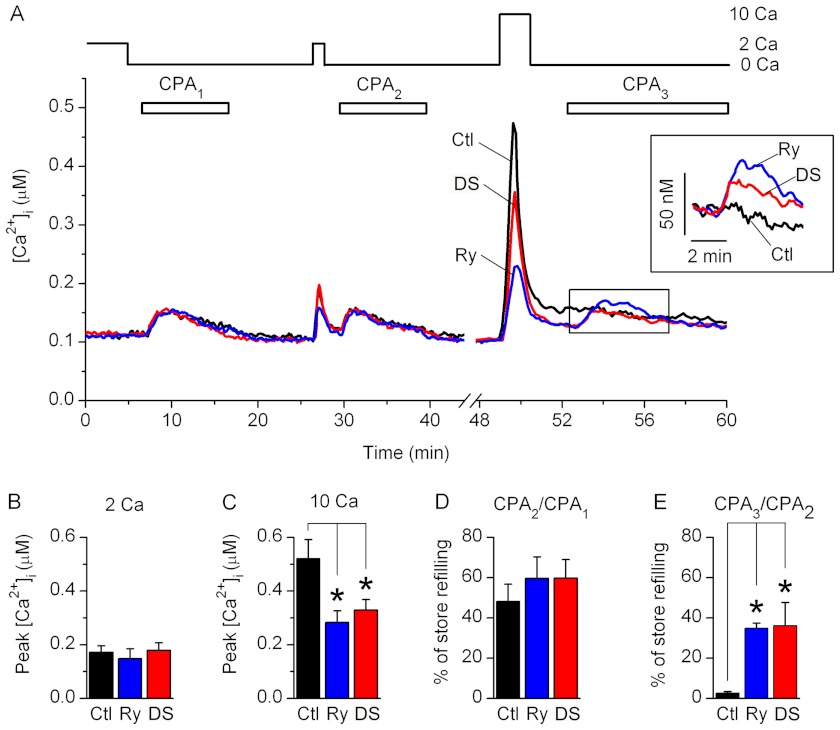
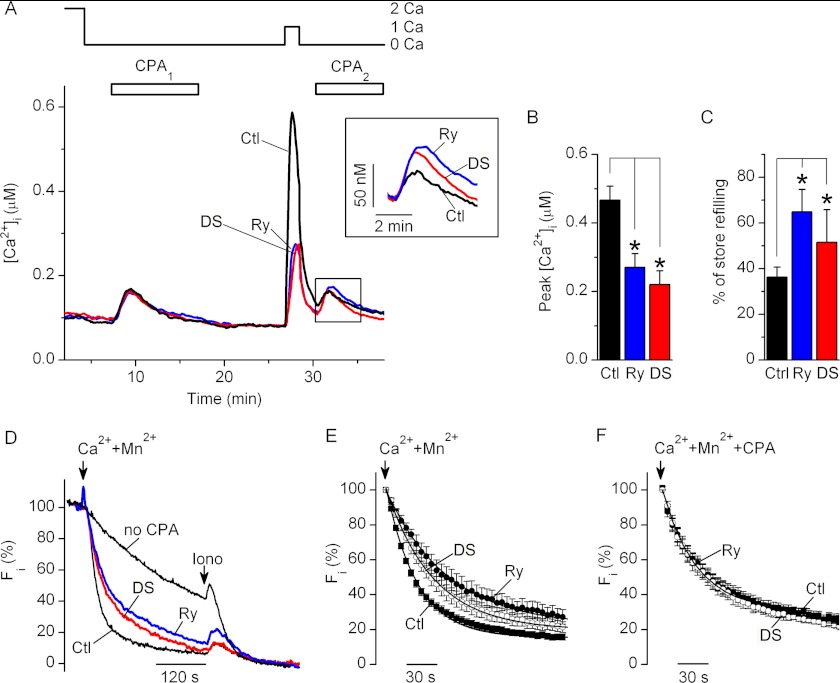
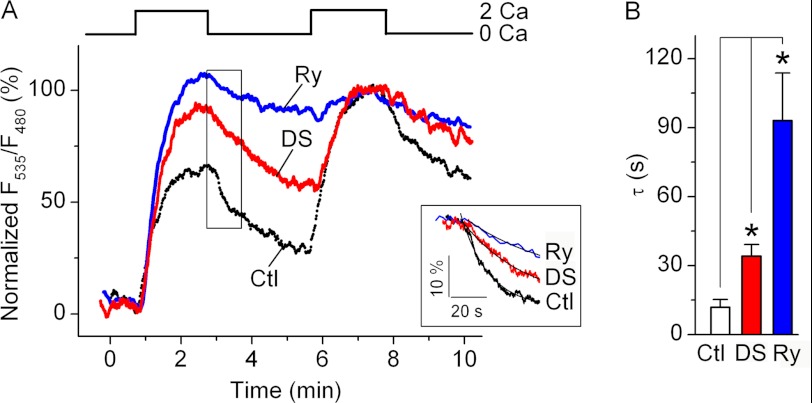
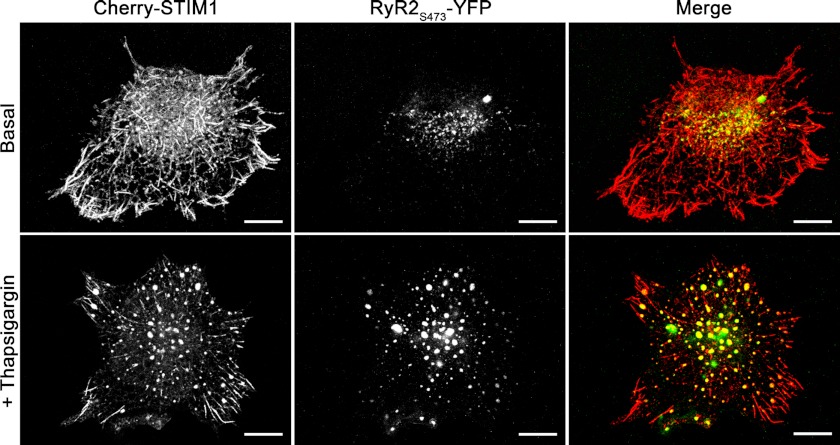
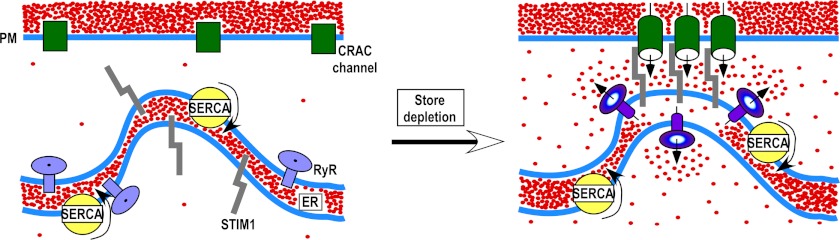
The expression and functional significance of ryanodine receptors (RyR) were investigated in resting and activated primary human T cells. RyR1, RyR2, and RyR3 transcripts were detected in human T cells. RyR1/2 transcript levels increased, whereas those of RyR3 decreased after T cell activation. RyR1/2 protein immunoreactivity was detected in activated but not in resting T cells. The RyR agonist caffeine evoked Ca(2+) release from the intracellular store in activated T cells but not in resting T cells, indicating that RyR are functionally up-regulated in activated T cells compared with resting T cells. In the presence of store-operated Ca(2+) entry (SOCE) via plasmalemmal Ca(2+) release-activated Ca(2+) (CRAC) channels, RyR blockers reduced the Ca(2+) leak from the endoplasmic reticulum (ER) and the magnitude of SOCE, suggesting that a positive feedback relationship exists between RyR and CRAC channels. Overexpression of fluorescently tagged RyR2 and stromal interaction molecule 1 (STIM1), an ER Ca(2+) sensor gating CRAC channels, in HEK293 cells revealed that RyR are co-localized with STIM1 in the puncta formed after store depletion. These data indicate that in primary human T cells, the RyR are coupled to CRAC channel machinery such that SOCE activates RyR via a Ca(2+)-induced Ca(2+) release mechanism, which in turn reduces the Ca(2+) concentration within the ER lumen in the vicinity of STIM1, thus facilitating SOCE by reducing store-dependent CRAC channel inactivation. Treatment with RyR blockers suppressed activated T cell expansion, demonstrating the functional importance of RyR in T cells.


Figures

FIGURE 1.
FIGURE 1.
RyR gene expression and function are up-regulated after T cell activation. A, average normalized linearized RyR1 (left), RyR2 (middle), and RyR3 (right) Cq values in resting T cells (R; n = 9) and 5-day activated (A; n = 7) primary human T cells. B, anti-RyR immunoreactivity (green) revealed with 34C primary mAb in resting (left) and 5-day activated (middle) T cells. Right, nonspecific staining of 5-day activated T cells produced by mouse IgG1 mAb (negative control). Scale bars, 5 μm. Optical slice depth < 4.5 μm. C, average levels of nonspecific background staining produced by IgG1 mAb (open bars) and RyR1/2 immunoreactivity detected with 34C mAb (green bars) in resting (R) and activated (A) T cells (n = 8). Before averaging, fluorescence intensities (F) were determined from confocal images recorded in the green channel as those shown in B and normalized to the number of cells in each image. a.u., arbitrary units. D, [Ca2+]i responses to caffeine (recorded from resting (left) and 5-day activated (right) T cells preincubated with vehicle (black trace), Ry (blue trace), or DS (red trace). Caffeine was applied as indicated. E, average caffeine-induced [Ca2+]i transients recorded from resting T cells (R, open bar; n = 4), control 5-day activated T cells pretreated with vehicle alone (Ctl; black bar; n = 7), and activated T cells pretreated with Ry (Ry; blue bar; n = 7) or DS (DS, red bar; n = 5). Levels of [Ca2+]i prior to caffeine application were subtracted before averaging. F, fluorescence profile of CFSE-loaded human T cells activated for 4 days in the presence of vehicle alone (Ctl, gray-filled histogram), Ry (Ry, histogram outlined by a blue line), or DS (DS, histogram outlined by a red line). The histogram outlined with dots represents the fluorescence profiles of CFSE-loaded resting T cells prior to activation (undivided cell population at time 0). The numbers in parentheses indicate a percentage of undivided cells in each group. Histogram peaks represent successive generations. Results shown are representative data from three experiments. * (in all panels), differences between means are significant (p < 0.01). Error bars, S.E.
FIGURE 2.
FIGURE 2.
Effects of RyR blockers on SOCE and store refilling in resting T cells. A, average changes in [Ca2+]i recorded from control resting T cells preincubated with vehicle alone (Ctl; black trace), Ry (blue trace), or DS (red trace). Nominally Ca2+-free (0 Ca) or 2 or 10 mm Ca2+-containing bath solutions (2 Ca and 10 Ca, respectively) were applied as indicated. CPA was sequentially applied three times as indicated (CPA1, CPA2, and CPA3). Inset, expanded boxed area; [Ca2+]i traces were aligned at the time of the third CPA application. B and C, average peak values of [Ca2+]i transients measured after the readdition of 2 mm (B) or 10 mm (C) Ca2+-containing bath solutions in control cells (Ctl; black bars) and in cells preincubated with Ry (blue bars) or DS (red bars). Levels of [Ca2+]i prior to the Ca2+ readdition were subtracted before averaging. D and E, average amount of store refilling following application of 2 mm (CPA2/CPA1 in D) or 10 mm (CPA3/CPA2 in E) Ca2+-containing bath solution (expressed as a percentage). Store refilling values were determined in control cells (Ctl; black bars) and in cells preincubated with Ry (blue bars) or DS (red bars). * (in all panels), differences between means are significant (p < 0.01). Six to seven experiments were performed for each condition. Error bars, S.E.
FIGURE 3.
FIGURE 3.
RyR inhibition attenuates SOCE and enhances store refilling in activated T cells. A, average changes in [Ca2+]i recorded from the control activated T cells preincubated with vehicle alone (Ctl; black trace), Ry (blue trace), or DS (red trace). Nominally Ca2+-free (0 Ca) or 1 or 2 mm Ca2+-containing bath solutions (1 Ca and 2 Ca, respectively) were applied as indicated. CPA was sequentially applied twice as indicated (CPA1 and CPA2). Inset, expanded boxed area; [Ca2+]i traces were aligned at the time of the second CPA application. B, average peak values of the [Ca2+]i transients after the readdition of 1 mm Ca2+-containing bath solution in cells preincubated with vehicle (Ctl; black bars), Ry (blue bars), or DS (red bars). Levels of [Ca2+]i prior to Ca2+-containing solution readdition were subtracted before averaging. C, average amounts of store refilling following SOCE (expressed as a percentage) in cells preincubated with vehicle (Ctl; black bars), Ry (blue bars), or DS (red bars). *, differences between means are significant (p < 0.05). Thirteen to fifteen experiments were performed for each condition. D, representative time courses of Mn2+ quenching of Fura-2 fluorescence (Fi) recorded from the cells that were not treated either with CPA or RyR blockers (no CPA; top black trace) or control cells preincubated with CPA alone (Ctl; bottom black trace), CPA and Ry (Ry; blue trace), or CPA and DS (DS; red trace). All traces were recorded after 10 min of CPA washout. Ionomycin (Iono; 1 μm) was applied at the end of each experiment to determine the background fluorescence level. The Fi values were normalized so that the Fi values determined just before the addition of Mn2+ and after application of ionomycin were taken as 100 and 0%, respectively. E and F, average time courses of normalized Mn2+-evoked Fura-2 quenching in cells preincubated with CPA and vehicle (Ctl; filled squares; n = 13 in E, and n = 5 in F), CPA and Ry (Ry; filled circles; n = 6 in E, and n = 5 in F), or CPA and DS (DS; open circles; n = 8 in E, and n = 5 in F). In E, CPA was washed out for 10 min in nominally Ca2+-free bath solution before Mn2+ application. In F, CPA was continuously present in all solutions. The arrows indicate timing of application of 0.5 mm Mn2+- and 2 mm Ca2+-containing solution. The solid lines are first order exponential functions fitted to experimental data. Error bars, S.E.
FIGURE 4.
FIGURE 4.
RyR inhibition reduces Ca2+ leakage from the store and facilitates store refilling in Jurkat YC4.2er cells. A, representative traces showing changes in [Ca2+]ER in control cells preincubated with vehicle alone (Ctl; black trace), 400 μm Ry (blue trace), or 30 μm DS (red trace). Prior to taking measurements, the CPA was applied for 10 min and then washed out for 10 min in Ca2+-free bath solution. Nominally Ca2+-free (0 Ca) and 2 mm Ca2+-containing (2 Ca) extracellular solutions were applied as indicated. The raw F535/F480 values, which are proportional to [Ca2+]ER, were normalized so that F535/F480 values determined just before the first application of 2 mm Ca2+-containing solution and 1.5 min after the second application of 2 mm Ca2+-containing solution were taken as 0 and 100%, respectively. Inset, expansion of the boxed area. Traces were aligned at the time of Ca2+-free bath solution application. The time constant (τ) of the F535/F480 decay was determined by fitting the initial 60-s segment of normalized F535/F480 traces recorded following application of Ca2+-free bath solution with a single exponential function (smooth lines in the inset). B, average values of τ obtained in control cells preincubated with vehicle alone (Ctl; black bar; n = 9), Ry (blue bar; n = 5), or DS (red bar; n = 4). *, differences between means are significant (p < 0.05). Error bars, S.E.
FIGURE 5.
FIGURE 5.
RyR co-localize with STIM1 puncta following store depletion in HEK293 cells. Confocal images of HEK293 cells co-overexpressing Cherry-STIM1 and RyR2S437-YFP recorded in red and green channels, respectively, prior to store depletion (top panels) and 10 min following incubation in bath solution supplemented with 1 μm thapsigargin (bottom panels). Right columns show merged images of Cherry-STIM1 and RyR2S437-YFP. Co-localization is depicted in yellow. Scale bar, 10 μm. Images were taken at the bottom of the cells; optical slice depth was <2.5 μm. Results shown are representative images from eight independent experiments.
FIGURE 6.
FIGURE 6.
Hypothetical scheme of RyR action in T cells. Store depletion causes translocation of STIM1, ORAI1, and RyR to the ER-plasma membrane (PM) junctional sites. STIM1 interacts with ORAI1 to open CRAC channels. Ca2+ that entered the cell via CRAC channels activates RyR that are in close proximity to CRAC channel clusters. SERCA pumps the Ca2+, which entered the cell via CRAC channels, into the ER lumen. Ca2+ leaks from the ER via RyR located in close proximity to STIM1. The local decline in [Ca2+]ER in the vicinity of STIM1 Ca2+-sensing domains stabilizes STIM1/ORAI1 coupling, which prevents CRAC channel inactivation in the presence of SOCE and global ER refilling.

Similar articles

Cited by

References

    1. Germain R. N. (2002) T-cell development and the CD4-CD8 lineage decision. Nat. Rev. Immunol. 2, 309–322 - PubMed
    1. Swain S. L. (1999) Helper T cell differentiation. Curr. Opin. Immunol. 11, 180–185 - PubMed
    1. Lewis R. S. (2001) Calcium signaling mechanisms in T lymphocytes. Annu. Rev. Immunol. 19, 497–521 - PubMed
    1. Metcalfe J. C., Pozzan T., Smith G. A., Hesketh T. R. (1980) A calcium hypothesis for the control of cell growth. Biochem. Soc. Symp. 45, 1–26 - PubMed
    1. Crabtree G. R. (1989) Contingent genetic regulatory events in T lymphocyte activation. Science 243, 355–361 - PubMed

MeSH terms