. 2012 Oct;153(10):5036-48.
doi: 10.1210/en.2012-1665. Epub 2012 Sep 4.

rpS6 Regulates blood-testis barrier dynamics by affecting F-actin organization and protein recruitment

Affiliations

rpS6 Regulates blood-testis barrier dynamics by affecting F-actin organization and protein recruitment

Ka-Wai Mok et al. Endocrinology. 2012 Oct.

Abstract

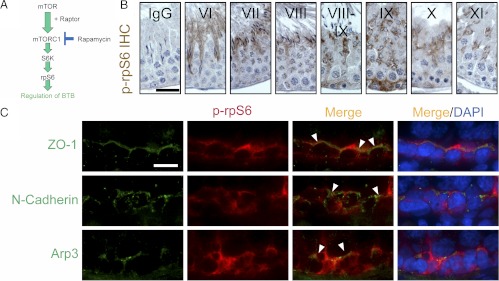
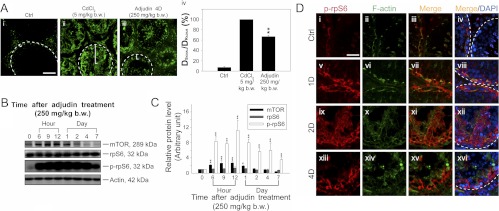
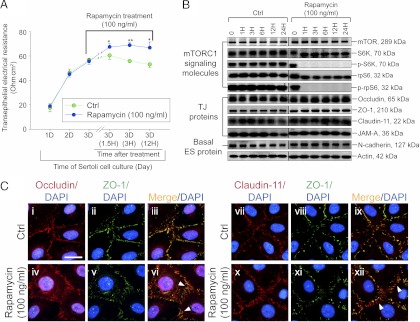
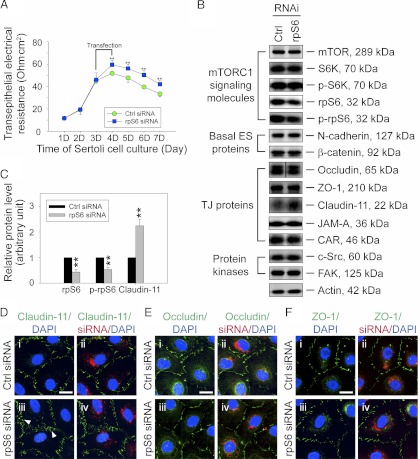
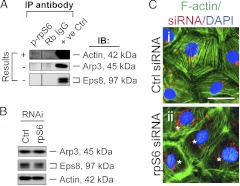
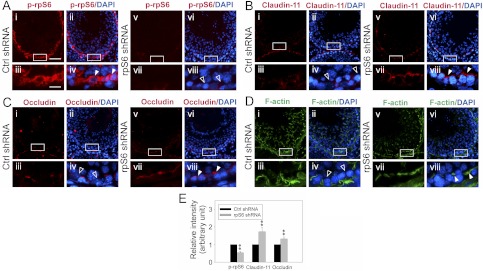
During spermatogenesis, preleptotene spermatocytes residing near the basement membrane of the seminiferous tubule must traverse the blood-testis barrier (BTB) at stage VIII-IX of the epithelial cycle to continue their development in the adluminal compartment. Unlike other blood-tissue barriers (e.g. the blood-brain barrier) that are created by the endothelial tight junction (TJ) barrier of capillaries, the BTB is created by specialized junctions between Sertoli cells in which TJ coexists with basal ectoplasmic specialization (basal ES, a testis-specific adherens junction). The basal ES is typified by the presence of tightly packed actin filament bundles sandwiched between cisternae of endoplasmic reticulum and the apposing plasma membranes of Sertoli cells. These actin filament bundles also confer unusual adhesive strength to the BTB. Yet the mechanisms by which these filamentous actin (F-actin) networks are regulated from the bundled to the debundled state to facilitate the transit of spermatocytes remain elusive. Herein, we provide evidence that ribosomal protein S6 (rpS6), the downstream signaling molecule of the mammalian target of rapamycin complex 1 (mTORC1) pathway, is a major regulator of F-actin organization and adhesion protein recruitment at the BTB. rpS6 is restrictively and spatiotemporally activated at the BTB during the epithelial cycle. An activation of rpS6 led to a disruption of the Sertoli cell TJ barrier and BTB integrity. Its silencing in vitro or in vivo by using small interfering RNA duplexes or short hairpin RNA was found to promote the Sertoli cell TJ permeability barrier by the recruitment of adhesion proteins (e.g. claudin-11 and occludin) to the BTB. Thus, rpS6 in the mTORC1 pathway regulates BTB restructuring via its effects on the F-actin organization and protein recruitment at the BTB.


Figures

Fig. 1.
Fig. 1.
Stage-specific localization of p-rpS6 at the BTB of adult rat testes. A, Schematic diagram of the mTOR/mTORC1 signaling pathway mediated via the downstream phosphorylated (activated) rpS6 (p-rpS6) downstream that regulates multiple cellular events including BTB dynamics. B, Immunohistochemical (IHC) localization of p-rpS6 in the seminiferous epithelium of adult rat testes illustrating stage-specific expression of p-rpS6 consistent with its localization at the BTB with p-rpS6 highly expressed at late-stage VIII to stage IX at the time of BTB restructuring, and p-rpS6 was also detected at the apical ES during the transit of elongating spermatids during spermiogenesis and during apical ES degeneration at spermiation at stage VIII. The panel of micrographs shown here is an abridged version of the IHC data shown in Supplemental Fig. 1. IgG illustrates the control panel in which the anti-p-rpS6 antibody (Table 1) was substituted with normal rabbit IgG. Roman numerals illustrate stages of the epithelial cycle. Scale bar, 50 μm, which applies to all micrographs in this panel. C, Colocalization of p-rpS6 (red) with three putative BTB-associated proteins: ZO-1 (green, a TJ-adaptor protein), N-cadherin (green, a basal ES-protein), and Arp3 (green, a BTB-associated actin regulatory protein known to induce F-actin nucleation and branching) in adult rat testes. Cell nuclei were stained with DAPI, and p-rpS6 was found to colocalize with ZO-1, N-cadherin, and Arp3 as annotated by white arrowheads, at the BTB. Scale bar, 25 μm, which applies to all micrographs in this panel.
Fig. 2.
Fig. 2.
A study of using an animal model by disrupting the BTB with an acute dose of adjudin (250 mg/kg BW) to assess changes in the level and localization of p-rpS6. A, Adult rats [∼300 g BW; n = 3 rats per time point in each treatment vs. control (Ctrl) groups] were treated with adjudin (250 mg/kg BW) by gavage as described (34) at d 0, and the BTB integrity was accessed on d 4 by its ability to block inulin-FITC from entering the adluminal compartment in the seminiferous epithelium behind the BTB. Normal rats served as negative controls, whereas rats treated with CdCl2 (5 mg/kg BW, ip) for 3 d, which is known to induce BTB disruption (32), served as positive controls. In normal rat testes with intact BTB, fluorescence signals were retained at the basal compartment (Ai), but for CdCl2-treated rats in which the BTB was disrupted, signals were found in the adluminal compartment (Aii). For testes from rats treated with an acute dose of adjudin, fluorescence signal was found behind the BTB, and in some tubules, signals were even detected in the lumen of tubules (see Aiii), illustrating the BTB had been compromised. White broken lines annotate the relative location of the basement membrane in a seminiferous tubule, which is adjacent to the BTB. White brackets in tubules indicate the relative distance traveled by inulin-FITC from the BTB with the BTB location annotated by the white broken line. Scale bar in Ai, 50 μm, which applies to i–iii. The findings in Ai–iii were summarized and semiquantitatively shown in a histogram shown in Aiv by comparing the ratio of the distance traveled by inulin-FITC from the BTB near the basement membrane (DSignal) to the tubule radius (DRadius) between the three groups. For tubules that were obliquely sectioned, DRadius was obtained by averaging the shortest and the longest radius from the basement membrane. Each bar represents mean ± sd of 60 tubules that were randomly selected and scored from testes of three rats for each time point. **, P < 0.01, compared with control group. B, Immunoblots of mTORC1 signaling molecules including mTOR, rpS6, and p-rpS6 (see Fig. 1A) using testis lysates at specified time points from rats after adjudin treatment. Actin served as a protein loading control. This is a representative set of data from three independent experiments. C, Histogram summarizing immunoblotting data of B, with each data point normalized against actin. Protein levels at 0 h were arbitrarily set as 1 against which statistical comparison was performed. Each bar represents a mean ± sd of n = 3. *, P < 0.05; **, P < 0.01. D, p-rpS6 (red) colocalized with F-actin (green) in frozen sections of rat testes after adjudin treatment; cell nuclei were stained with DAPI. In control (Ctrl), p-rpS6 was expressed at the BTB near the basement membrane indicated by white broken lines and was restricted only to tubules at late-stage VIII–IX (i–iv) (see Fig. 1A and Supplemental Fig. 1). But after adjudin treatment, p-rpS6 was found in tubules regardless of their stages (v–viii). In addition, the organization of F-actin was disrupted after adjudin treatment (ii, vi, x, and xiv), and the disorganized F-actin also partially colocalized with the up-regulated p-rpS6 (v–xvi vs. i–iv), supporting the notion that p-rpS6 takes part in actin disorganization induced by adjudin. Scale bar in Di, 50 μm, which applies to i–xvi.
Fig. 3.
Fig. 3.
The functional role of rpS6 at the Sertoli BTB in vitro. Rapamycin is an effective inhibitor of mTORC1 that suppresses its substrate S6K in the mTOR signaling pathway; this, in turn, blocks the phosphorylation and activation of rpS6 to form p-rpS6 (8, 16), modulating the TJ permeability barrier (see Fig. 1A). A, The establishment of a functional Sertoli cell TJ permeability barrier was assessed by quantifying TER across the cell epithelium. By d 3, when the TJ barrier was established, cells were treated with rapamycin (100 ng/ml), and a blockade of rpS6 activation (p-rpS6 production was abolished, as shown in B) was found to promote Sertoli TJ barrier function. Each data point is a mean ± sd of n = 4 replicates from a representative experiment, which was repeated three times using different batches of Sertoli cells and yielded similar results. *, P < 0.05; **, P < 0.01 compared with corresponding controls (Ctrl). B, Representative immunoblots showing the steady-state levels of signaling molecules of the mTORC1 pathway vs. TJ and basal ES proteins using Sertoli cell lysates terminated at specified time points after rapamycin treatment with n = 4 independent experiments (see Supplemental Fig. 5 which summarizes results of these immunoblots). These data thus confirmed that rapamycin virtually blocked the formation of p-rpS6 (i.e. the activated form of rpS6) and p-S6K (i.e. the activated form of S6K) and inhibited the steady-state level of rpS6 but not S6K, which was accompanied by a mild increase in claudin-11, occludin, ZO-1, and JAM-A by 24-h after rapamycin treatment, but not N-cadherin. Actin served as a protein loading control. C, Changes in the localization of TJ proteins, such as occludin (red), ZO-1 (green), and clauidn-11(red), after treatment with rapamycin for 20 h. ZO-1 was found to colocalize with occludin or claudin-11 and appeared as orange fluorescence with Sertoli cell nuclei visualized by DAPI (blue) staining. After rapamycin treatment, occludin and claudin-11, but not ZO-1, were found to localize considerably more at the Sertoli cell-cell interface (see white arrowheads) but less in the cell cytosol, supporting data in A. Scale bar, 50 μm in the first micrograph, which applies to all other micrographs.
Fig. 4.
Fig. 4.
A knockdown of rpS6 by RNAi promotes the Sertoli cell TJ permeability barrier function in vitro. A, Sertoli cells cultured in vitro established a functional TJ barrier that mimicked the BTB in vivo when its barrier function was assessed by TER across the cell epithelium. On d 3, Sertoli cells were transfected with rpS6-specific siRNA duplexes vs. nontargeting control siRNA duplexes for 24 h. A knockdown of rpS6 (and also p-rpS6) by approximately 60% (B and C) was found to promote the TJ-barrier function significantly vs. controls (Ctrl). Each data point is a mean ± sd of n = 5 replicates from a representative experiment, which was repeated three times using different batches of Sertoli cells and yielded similar results. **, P < 0.01. B, Immunoblots showing the steady-state levels of signaling molecules and their activated (phosphorylated) forms in the mTORC1 pathway, basal ES proteins, TJ proteins, and protein kinases using lysates of Sertoli cells terminated 2 d after transfection. Actin served as a protein loading control. This is a representative set of data from four experiments. It was noted that the knockdown of rpS6 did not induce any off-target effects except an induction in claudin-11. C, Histogram summarizing selected immunoblotting results such as those shown in B and normalized against actin. Protein levels of the nontargeting control group (Ctrl) were arbitrarily set at 1 against which statistical comparison was performed. Each bar is a mean ± sd of n = 4. **, P < 0.01. D–F, Changes in localization of TJ proteins, such as claudin-11 (green) (D), occludin (green) (E), and ZO-1 (green) (F) at the Sertoli cell-cell interface after rpS6 knockdown were assessed 2 d after transfection. Sertoli cell nuclei were stained with DAPI, and red siGLO was used to illustrate successful transfection. Note that considerably more claudin-11 was detected at the Sertoli cell-cell interface (see white arrowheads in Diii) after rpS6 knockdown (D, iii and iv vs. i and ii), whereas there were no observable changes detected in the localization of occludin (E) and ZO-1 (F). Bar in i (D–F), 25 μm, which applies to i–iv.
Fig. 5.
Fig. 5.
rpS6 regulates actin organization in Sertoli cells. A, A co-IP study using lysates of normal adult rat testes to access any structural protein-protein interactions between p-rpS6 and actin, Arp3 (a component of the Arp2/3 complex that regulates actin filament nucleation and branching), or Eps8 (an actin filament-barbed end capping and -bundling protein). Testis lysates incubated with normal rabbit IgG instead of an anti-rpS6 antibody were used as a negative control, and lysates from normal rat testes without being subjected to co-IP served as a positive control (+ve Ctrl); p-rpS6 was found to associate with actin but not the actin-regulating proteins Arp3 and Eps8. This is a representative set of data from three independent experiments. B, Immunoblots (IB) showing the steady-state levels of actin-regulating proteins Arp3 and Eps8 using Sertoli cell lysates 2 d after transfection of siRNA duplexes for rpS6 knockdown by approximately 60% (see Fig. 4), illustrating rpS6 knockdown caused a mild reduction of actin-bundling protein Eps8. Actin served as a protein loading control. This is a representative set of data from four experiments. C, Changes in Sertoli cell F-actin organization after knockdown of rpS6. Sertoli cell nuclei were visualized by DAPI, and red siGLO was used to illustrate successful transfection. It is noted that after transfection of Sertoli cells with rpS6-specific siRNA duplexes for RNAi, F-actin was localized more intensely at the cortical side of cells (these cells are denoted by asterisks), appearing to strengthen adhesion at the Sertoli cell-cell interface (ii vs. i), supporting the data shown in Fig. 4A. Bar in Ci, 20 μm, which applies to i and ii.
Fig. 6.
Fig. 6.
An in vivo study assessing the role of p-rpS6 in BTB function by RNAi using rpS6-specific shRNA. A–D, Eight micrograms of vector containing shRNA targeting rpS6 vs. nontargeting shRNA was administered to each testis in adult rats [∼300 g BW; n = 4 rats per time point in both treatment and control (Ctrl) groups] per day for 2 consecutive days, and testes were collected on d 3–5 after the first injection. Frozen sections of testes were used to study changes in the localization of p-rpS6 (red) (A) in late-stage VIII–IX tubules, claudin-11 (red) (B) in stage IX tubules, occludin (red) (C) in stage VIII tubules, and actin (green) (D) in late-stage VIII–IX tubules in the rpS6 knockdown group vs. control group. Tubules at these stages were selected for better illustration of changes in protein localization and/or recruitment after rpS6 knockdown by shRNA because at these stages in normal rat testes, the expression of claudin-11 and occludin at the BTB was considerably weakened vs. other stages [see i–iv in B and C, which are consistent with an earlier report (30)], and the distinctive F-actin network at the BTB was also considerably weakened (see D, i-iv). These stage-specific changes thus facilitate BTB restructuring to accommodate the transit of preleptotene spermatocytes at the site at stage VIII–IX. Nuclei were stained with DAPI. Magnified views of the boxed area shown in i, ii, v, and vi of A–D are shown in iii, iv, vii, and viii of A–D, respectively. A, Considerably more intense staining (see white arrowheads) of p-rpS6 was detected near the basement membrane of late-stage stage VIII–IX tubules at the BTB site from rat testes transfected with nontargeting control (Ctrl) shRNA (i–iv) vs. corresponding tubules from testes transfected with rpS6-specific shRNA (see open arrowheads) (v–viii), illustrating successful knockdown of rpS6 by using rpS6 shRNA. B–D, Considerably more claudin-11, occludin-11, and F-actin was also found at the BTB near the basement membrane from tubules at stage IX, VIII, and late VIII–IX, respectively, in rat testes after rpS6 knockdown (see white arrowheads) vs. the corresponding control tubules (see open arrowheads) (B, v–viii vs. i–iv; C, v–viii vs. i–iv; D, v–viii vs. i–iv). Scale bar in Ai, 100 μm, which applies to i, ii, v, and vi of A–D; scale bar in Aiii, 25 μm, which applies to iii, iv, vii, and viii of A–D. E, Changes in the intensity of claudin-11 (in stage IX tubules) and occludin (in stage VIII tubules) in the rpS6 knockdown testes by shRNA vs. the corresponding nontargeting controls shown in A–C were quantified by using ImageJ software by scoring about 40 tubules at specified stages. Each bar represents mean ± sd (n = 4 rats with approximately 10 randomly selected tubules per testis and a total of four testes were scored). The staining intensity in control testes was arbitrarily set at 1, against which statistical analysis was performed. **, P < 0.01.

Similar articles

Cited by

References

    1. Cheng CY, Mruk DD. 2012. The blood-testis barrier and its implication in male contraception. Pharmacol Rev 64:16–64 - PMC - PubMed
    1. Cheng CY, Mruk DD. 2010. A local autocrine axis in the testes that regulates spermatogenesis. Nat Rev Endocrinol 6:380–395 - PMC - PubMed
    1. Cheng YH, Wong EW, Cheng CY. 2011. Cancer/testis (CT) antigens, carcinogenesis and spermatogenesis. Spermatogenesis 1:209–220 - PMC - PubMed
    1. Hertzog M, Milanesi F, Hazelwood L, Disanza A, Liu H, Perlade E, Malabarba MG, Pasqualato S, Maiolica A, Confalonieri S, Le Clainche C, Offenhauser N, Block J, Rottner K, Di Fiore PP, Carlier MF, Volkmann N, Hanein D, Scita G. 2010. Molecular basis for the dual function of Eps8 on actin dynamics: bundling and capping. PLoS Biol 8:e1000387. - PMC - PubMed
    1. Lie PP, Mruk DD, Lee WM, Cheng CY. 2009. Epidermal growth factor receptor pathway substrate 8 (Eps8) is a novel regulator of cell adhesion and the blood-testis barrier integrity in the seminiferous epithelium. FASEB J 23:2555–2567 - PMC - PubMed

Publication types

MeSH terms