

Biosynthesis of 3-iodothyronamine (T1AM) is dependent on the sodium-iodide symporter and thyroperoxidase but does not involve extrathyroidal metabolism of T4
- PMID: 22948220
- PMCID: PMC3473208
- DOI: 10.1210/en.2012-1254
Biosynthesis of 3-iodothyronamine (T1AM) is dependent on the sodium-iodide symporter and thyroperoxidase but does not involve extrathyroidal metabolism of T4
Abstract
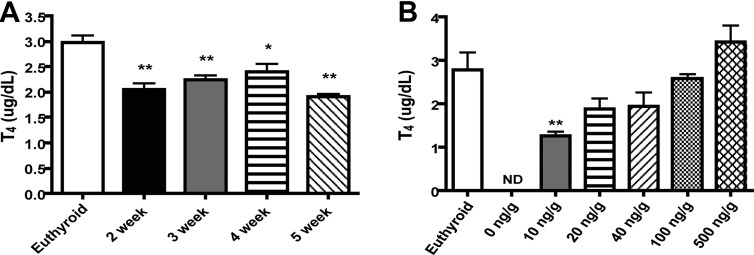
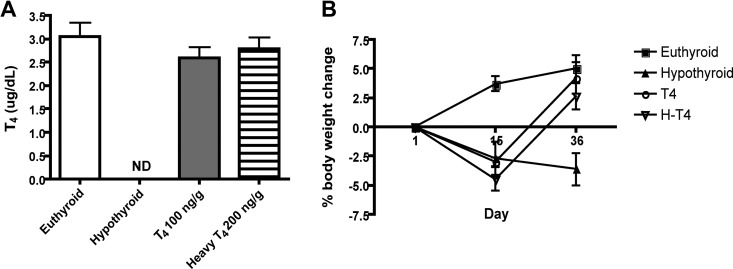
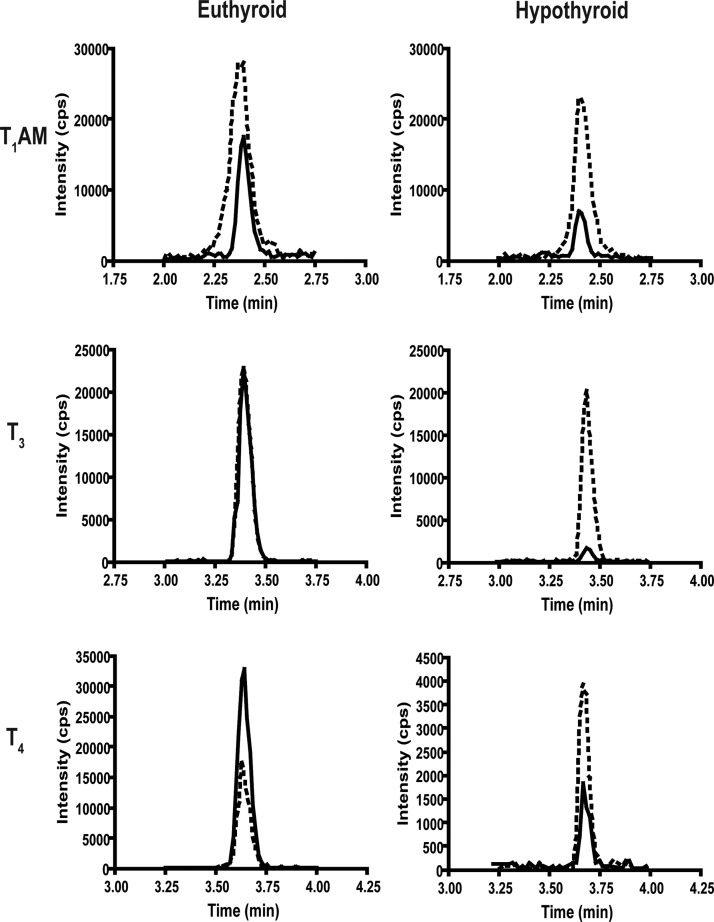
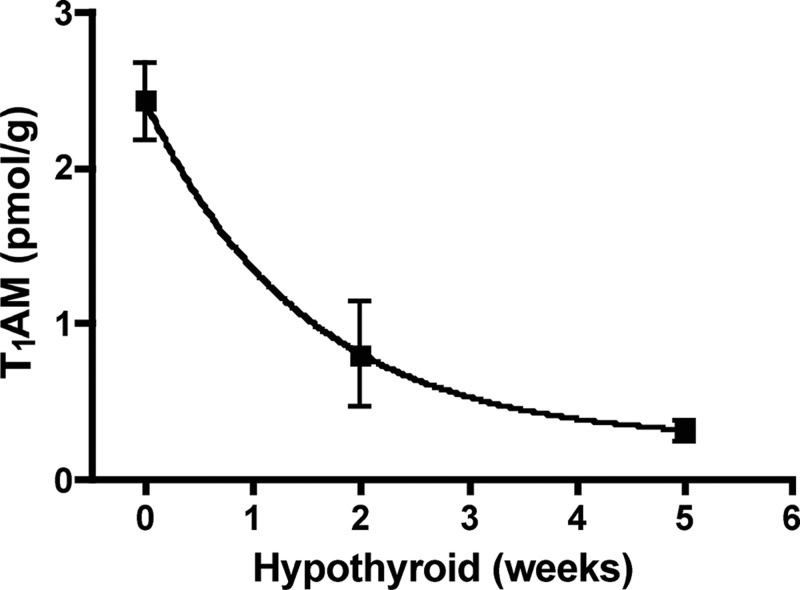
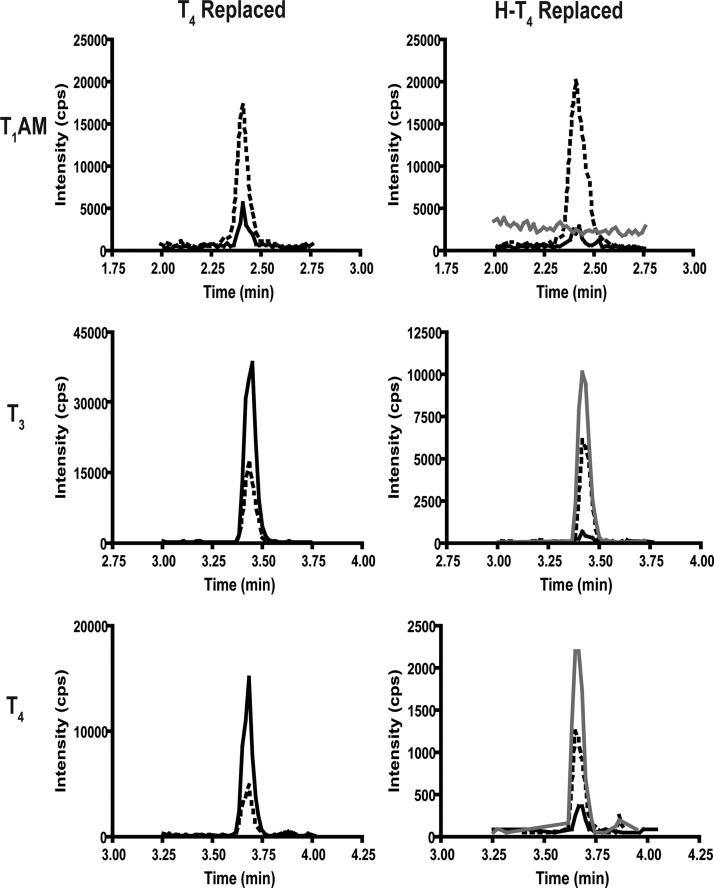
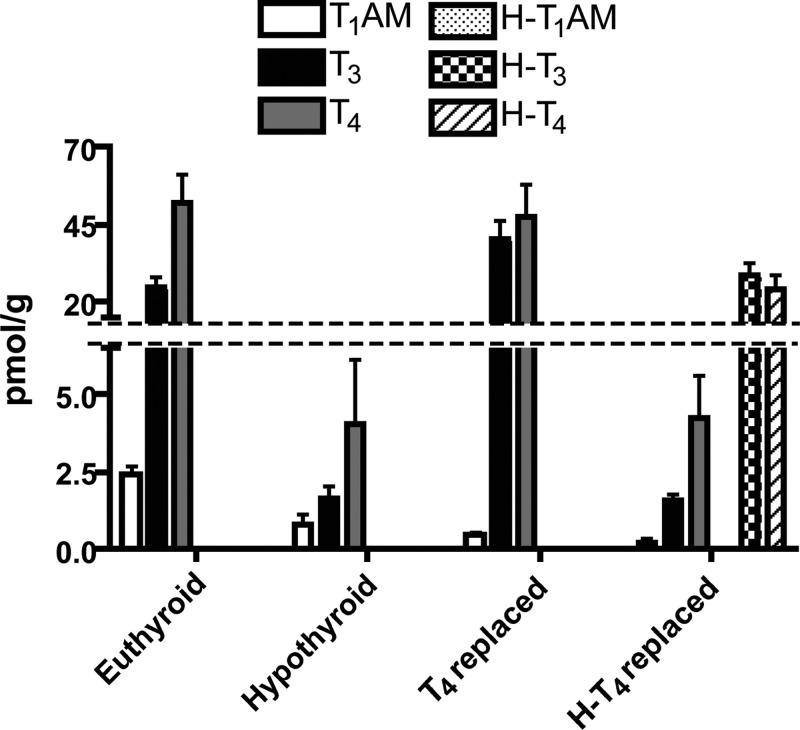
3-Iodothyronamine (T(1)AM) is an endogenous thyroid hormone derivative with unknown biosynthetic origins. Structural similarities have led to the hypothesis that T(1)AM is an extrathyroidal metabolite of T(4). This study uses an isotope-labeled T(4) [heavy-T(4) (H-T(4))] that can be distinguished from endogenous T(4) by mass spectrometry, which allows metabolites to be identified based on the presence of this unique isotope signature. Endogenous T(1)AM levels depend upon thyroid status and decrease upon induction of hypothyroidism. However, in hypothyroid mice replaced with H-T(4), the isotope-labeled H-T(3) metabolite is detected, but no isotope-labeled T(1)AM is detected. These data suggest that T(1)AM is not an extrathyroidal metabolite of T(4), yet is produced by a process that requires the same biosynthetic factors necessary for T(4) synthesis.
Figures
Similar articles
-
Biosynthesis of 3-Iodothyronamine From T4 in Murine Intestinal Tissue.Endocrinology. 2015 Nov;156(11):4356-64. doi: 10.1210/en.2014-1499. Epub 2015 Sep 8. Endocrinology. 2015. PMID: 26348473
-
3-Iodothyronamine Decreases Expression of Genes Involved in Iodide Metabolism in Mouse Thyroids and Inhibits Iodide Uptake in PCCL3 Thyrocytes.Thyroid. 2017 Jan;27(1):11-22. doi: 10.1089/thy.2016.0182. Epub 2016 Dec 21. Thyroid. 2017. PMID: 27788620
-
Effect of chronic excess iodine intake on thyroid function and oxidative stress in hypothyroid rats.Can J Physiol Pharmacol. 2012 May;90(5):617-25. doi: 10.1139/y2012-046. Epub 2012 May 2. Can J Physiol Pharmacol. 2012. PMID: 22550940
-
Metabolic pathways of tetraidothyronine and triidothyronine production by thyroid gland: a review of articles.Pak J Biol Sci. 2011 Jan 1;14(1):1-12. doi: 10.3923/pjbs.2011.1.12. Pak J Biol Sci. 2011. PMID: 21913492 Review.
-
The effects of iodine deficiency on thyroid hormone deiodination.Thyroid. 2005 Aug;15(8):917-29. doi: 10.1089/thy.2005.15.917. Thyroid. 2005. PMID: 16131334 Review.
Cited by
-
Metabolic Reprogramming by 3-Iodothyronamine (T1AM): A New Perspective to Reverse Obesity through Co-Regulation of Sirtuin 4 and 6 Expression.Int J Mol Sci. 2018 May 22;19(5):1535. doi: 10.3390/ijms19051535. Int J Mol Sci. 2018. PMID: 29786646 Free PMC article.
-
Trace Amine-Associated Receptor 1 Localization at the Apical Plasma Membrane Domain of Fisher Rat Thyroid Epithelial Cells Is Confined to Cilia.Eur Thyroid J. 2015 Sep;4(Suppl 1):30-41. doi: 10.1159/000434717. Epub 2015 Jun 10. Eur Thyroid J. 2015. PMID: 26601071 Free PMC article.
-
Thyroid hormone signaling in energy homeostasis and energy metabolism.Ann N Y Acad Sci. 2014 Apr;1311:77-87. doi: 10.1111/nyas.12374. Epub 2014 Feb 20. Ann N Y Acad Sci. 2014. PMID: 24697152 Free PMC article. Review.
-
Thyroid Hormone Biomonitoring: A Review on Their Metabolism and Machine-Learning Based Analysis on Effects of Endocrine Disrupting Chemicals.Environ Health (Wash). 2024 Mar 4;2(6):350-372. doi: 10.1021/envhealth.3c00184. eCollection 2024 Jun 21. Environ Health (Wash). 2024. PMID: 39473465 Free PMC article. Review.
-
TREM2 is thyroid hormone regulated making the TREM2 pathway druggable with ligands for thyroid hormone receptor.Cell Chem Biol. 2022 Feb 17;29(2):239-248.e4. doi: 10.1016/j.chembiol.2021.07.014. Epub 2021 Aug 9. Cell Chem Biol. 2022. PMID: 34375614 Free PMC article.
References
-
- Yen PM. 2001. Physiological and molecular basis of thyroid hormone action. Physiol Rev 81:1097–1142 - PubMed
-
- Sun ZQ, Ojamaa K, Coetzee WA, Artman M, Klein I. 2000. Effects of thyroid hormone on action potential and repolarizing currents in rat ventricular myocytes. Am J Physiol Endocrinol Metab 278:E302–E307 - PubMed
-
- Bergh JJ, Lin HY, Lansing L, Mohamed SN, Davis FB, Mousa S, Davis PJ. 2005. Integrin αVβ3 contains a cell surface receptor site for thyroid hormone that is linked to activation of mitogen-activated protein kinase and induction of angiogenesis. Endocrinology 146:2864–2871 - PubMed
