. 2012 Sep;105(9):452-9.
doi: 10.1097/SMJ.0b013e3182621a2c.

Propagation of uncertainty in Bayesian diagnostic test interpretation

Affiliations

Propagation of uncertainty in Bayesian diagnostic test interpretation

Preethi Srinivasan et al. South Med J. 2012 Sep.

Abstract

Objectives: Bayesian interpretation of diagnostic test results usually involves point estimates of the pretest probability and the likelihood ratio corresponding to the test result; however, it may be more appropriate in clinical situations to consider instead a range of possible values to express uncertainty in the estimates of these parameters. We thus sought to demonstrate how uncertainty in sensitivity, specificity, and disease pretest probability can be accommodated in Bayesian interpretation of diagnostic testing.

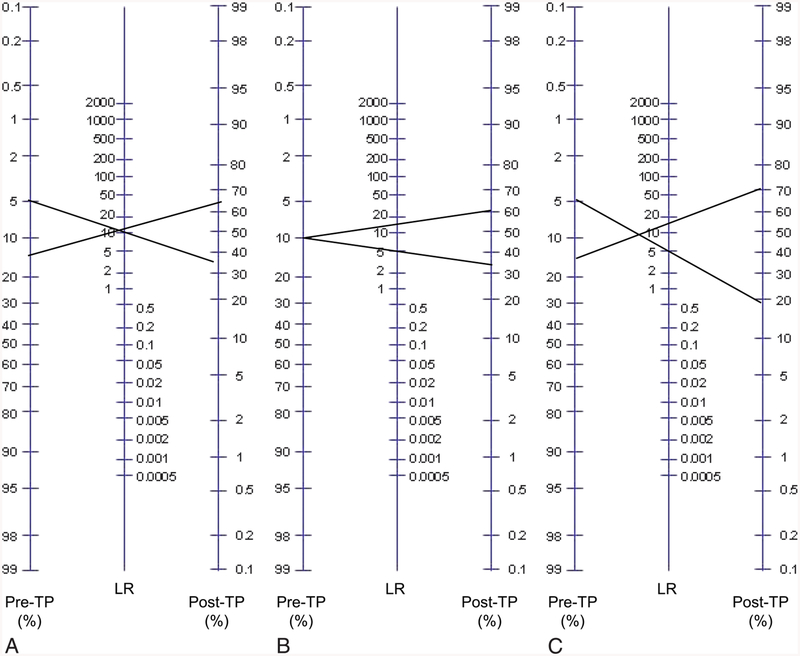
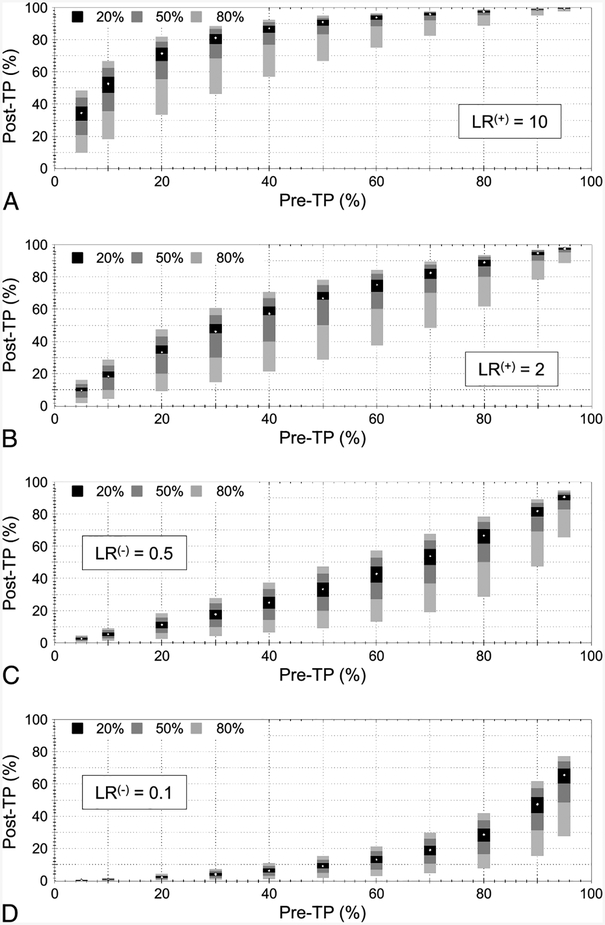
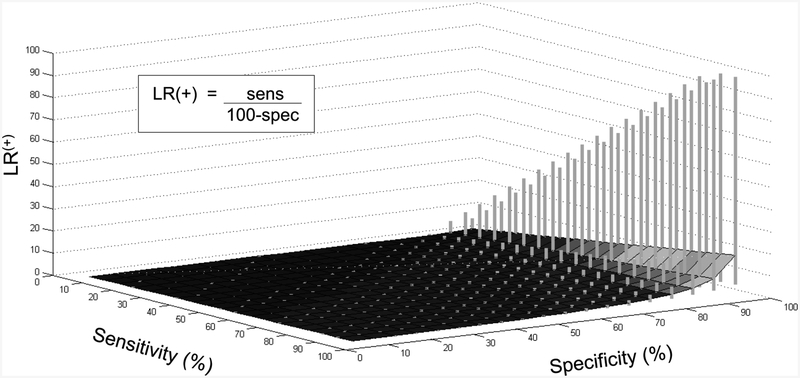
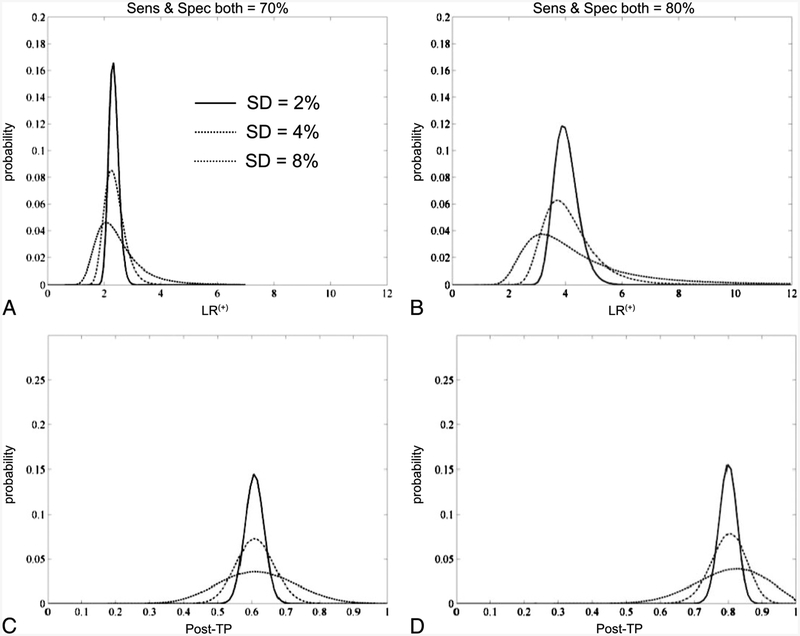
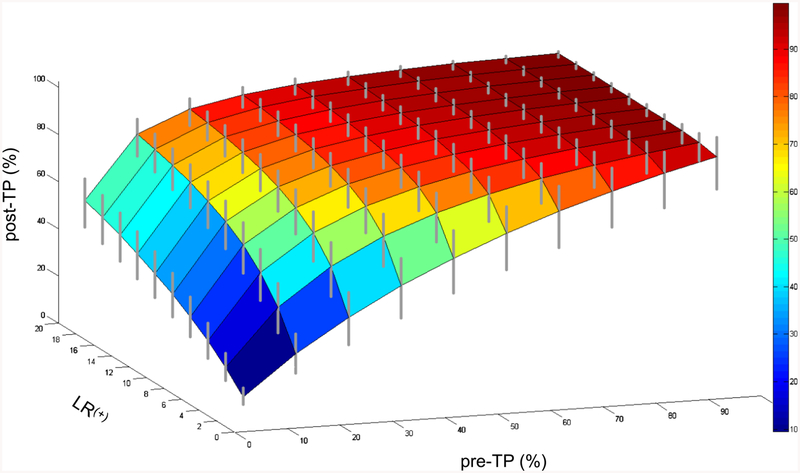
Methods: We investigated three questions: How does uncertainty in the likelihood ratio propagate to the posttest probability range, assuming a point estimate of pretest probability? How does uncertainty in the sensitivity and specificity of a test affect uncertainty in the likelihood ratio? How does uncertainty propagate when present in both the pretest probability and the likelihood ratio?

Results: Propagation of likelihood ratio uncertainty depends on the pretest probability and is more prominent for unexpected test results. Uncertainty in sensitivity and specificity propagates into the calculation of likelihood ratio prominently as these parameters approach 100%; even modest errors of ± 10% caused dramatic propagation. Combining errors of ± 20% in the pretest probability and in the likelihood ratio exhibited modest propagation to posttest probability, suggesting a realistic target range for clinical estimations.

Conclusions: The results provide a framework for incorporating ranges of uncertainty into Bayesian reasoning. Although point estimates simplify the implementation of Bayesian reasoning, it is important to recognize the implications of error propagation when ranges are considered in this multistep process.


Figures

Fig. 1.
Fig. 1.
Visualizing uncertainty in the Bayes nomogram. The standard Bayes nomogram (adapted from www.CEBM.net) consists of a column of pretest probability (pre-TP) and a column of likelihood ratio (LR) values, and a column of post-TP values. One simply draws a line connecting point estimates of pre-TP and LR of a given test result and extends the line to read the resulting post-TP of disease. Ranges of pre-TP (A), LR (B), or both (C) are shown to illustrate propagation of uncertainty. Note the similar growth of post-TP disease uncertainty when considering component uncertainty in either pre-TP (A) or LR (B). When both steps contain uncertainty, the post-TP range is even larger (C), with the limits being formed by the lower limit of the pre-TP range (5%) mapping through the lower limit of the LR (5), and the upper limit of pre-TP (15%) mapping through the upper limit of LR (15).
Fig. 2.
Fig. 2.
Uncertainty in posttest probability (post-TP) owing to uncertainty in the likelihood ratio (LR). Three ranges of LR uncertainty are considered: ±20%, ±50%, and ±80%. In each panel, 11 pretest probability (pre-TP) point estimates are considered (X-axis). Test results included LR(+) values of 10 (A) and 2 (B), and LR(−) values of 0.5 (C) and 0.1 (D). The white point in the center of each stacked vertical bar is the post-TP corresponding to a point estimate of LR, whereas the solid bars represent the uncertainty range in pre-TP corresponding to LR ranges of ±20% (black), ±50% (dark gray), and ±80% (light gray).
Fig. 3.
Fig. 3.
Uncertainty in LR owing to uncertainty in sensitivity and specificity. Sensitivity (Y-axis) and specificity (X-axis) contribute to the positive likelihood ratio (LR(+)) value (Z-axis), defined as shown in the inset. The contour surface represents the LR value calculated from the corresponding point estimates for sensitivity and specificity. The vertical gray bars represent the range in LR(+) values obtained when considering ±10% uncertainty in the sensitivity and specificity. The “clipping”seen at the highest ranges of LR uncertainty occur because values were truncated at 99.0%.
Fig. 4.
Fig. 4.
Uncertainty modeled with Monte Carlo simulations. Two hypothetical tests with sensitivity and specificity values of 70% each (A) or 80% each (B) are shown with uncertainty around these values expressed as normal distributions with standard deviations of 2%, 4%, or 8%. The X-axis in these panels represents the resulting positive likelihood ratio (LR(+)) values when calculated based on random draws from the sensitivity and specificity distributions. The Y-axis represents the probability of observing any given LR(+) value. The warping of the resulting LR(+) value distribution is attributed to the nonlinear aspect of Bayes’ theorem. C, The resulting posttest probability (post-TP) after applying the LR(+) values of A to a point estimate of pre-TP = 20%. D, The same process, using the test in B.
Fig. 5.
Fig. 5.
Uncertainty in posttest probability (post-TP) owing to uncertainty in both the pretest probability (pre-TP) and the likelihood ratio (LR). The pre-TP (X-axis) and LR (Y-axis) contribute to the post-TP (Z-axis). The contour surface is formed by the point estimates of pre-TP and LR values, yielding point estimates of post-TP. The gray vertical bars represent the range of post-TP uncertainty obtained when the LR uncertainty is ±20% and the pre-TP uncertainty is ±20%.

Comment in

Similar articles

Cited by

References

    1. Gallagher EJ. Clinical utility of likelihood ratios. Ann Emerg Med 1998;31:391–397. - PubMed
    1. Halkin A, Reichman J, Schwaber M, et al. Likelihood ratios: getting diagnostic testing into perspective. Q J Med 1998;91:247–258. - PubMed
    1. Dolan JG, Bordley DR, Mushlin AI. An evaluation of clinicians’ subjective prior probability estimates. Med Decis Making 1986; 6: 216–223. - PubMed
    1. Lyman GH, Balducci L. Overestimation of test effects in clinical judgment. J Cancer Educ 1993;8:297–307. - PubMed
    1. Lyman GH, Balducci L. The effect of changing disease risk on clinical reasoning. J Gen Intern Med 1994;9:488–495. - PubMed

Publication types