Review
. 2012 Sep;26(9):1986-2010.
doi: 10.1038/leu.2012.122.

EuroFlow standardization of flow cytometer instrument settings and immunophenotyping protocols

Affiliations
Free PMC article
Review

EuroFlow standardization of flow cytometer instrument settings and immunophenotyping protocols

T Kalina et al. Leukemia. 2012 Sep.
Free PMC article

Abstract

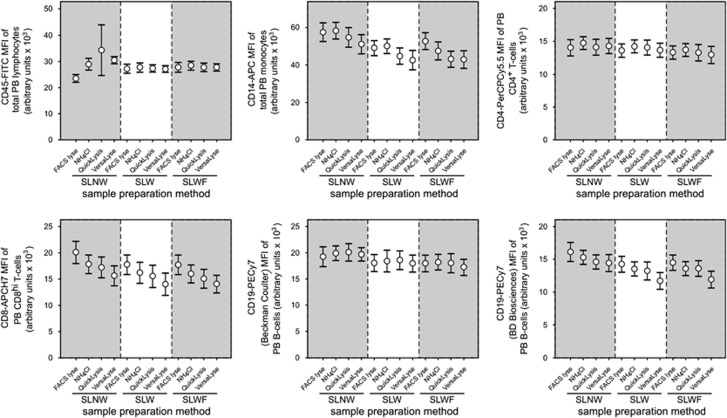
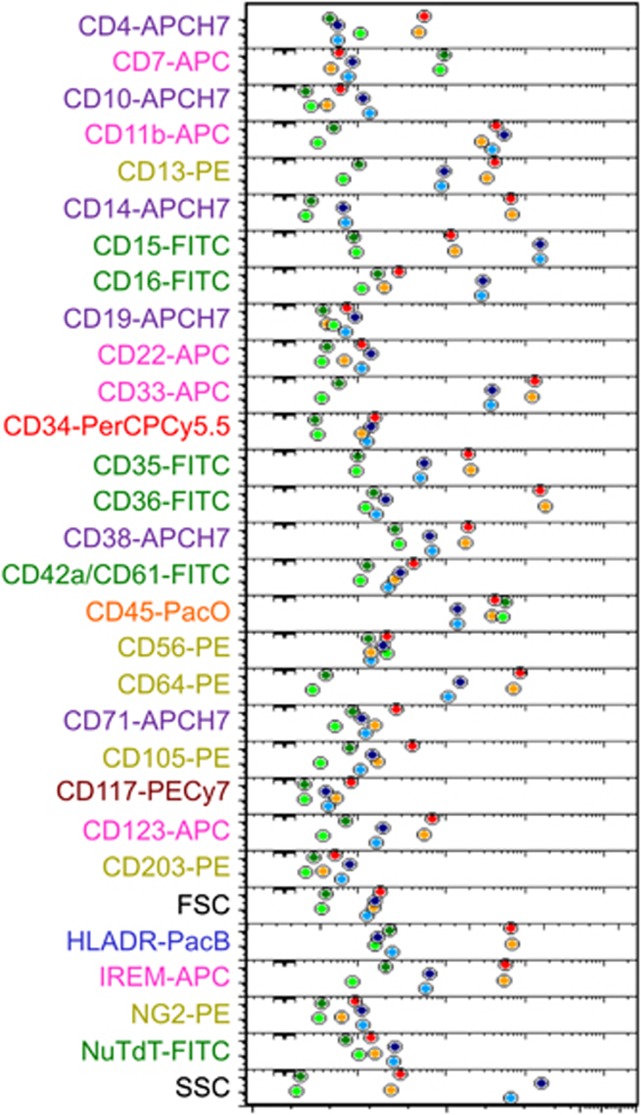
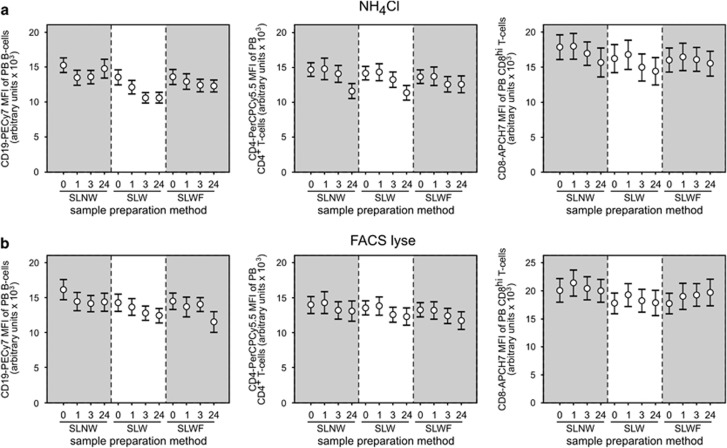
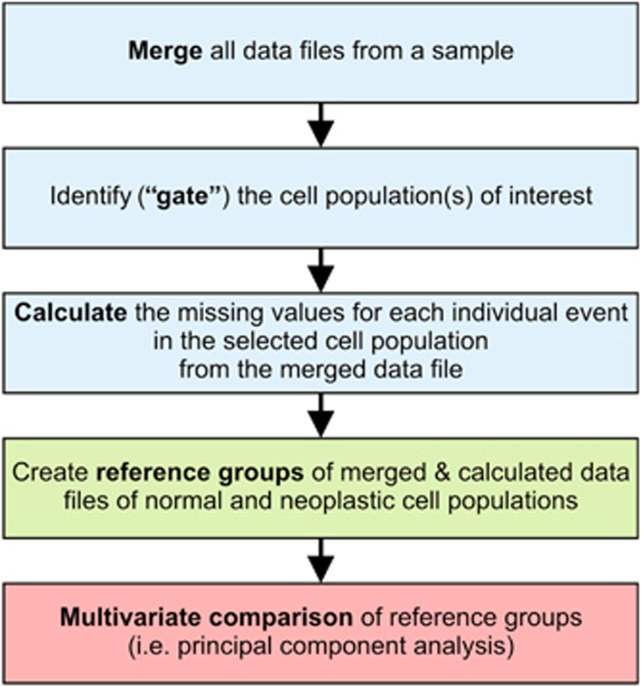
The EU-supported EuroFlow Consortium aimed at innovation and standardization of immunophenotyping for diagnosis and classification of hematological malignancies by introducing 8-color flow cytometry with fully standardized laboratory procedures and antibody panels in order to achieve maximally comparable results among different laboratories. This required the selection of optimal combinations of compatible fluorochromes and the design and evaluation of adequate standard operating procedures (SOPs) for instrument setup, fluorescence compensation and sample preparation. Additionally, we developed software tools for the evaluation of individual antibody reagents and antibody panels. Each section describes what has been evaluated experimentally versus adopted based on existing data and experience. Multicentric evaluation demonstrated high levels of reproducibility based on strict implementation of the EuroFlow SOPs and antibody panels. Overall, the 6 years of extensive collaborative experiments and the analysis of hundreds of cell samples of patients and healthy controls in the EuroFlow centers have provided for the first time laboratory protocols and software tools for fully standardized 8-color flow cytometric immunophenotyping of normal and malignant leukocytes in bone marrow and blood; this has yielded highly comparable data sets, which can be integrated in a single database.


Figures

Figure 1
Figure 1
Comparison of cytometer setting & tracking (CS&T) module and EuroFlow baseline settings obtained for the fluorescein isothiocyanate (FITC) channel (blue laser line) in one representative instrument. CS&T (mid-fluorescence peak in a) and EuroFlow (Rainbow beads brightest, eighth peak in b) baseline settings are compared in c (gray and red vertical lines, respectively) for the robust coefficient of variation (CV) and robust electronic noise (SDEN). Note that although EuroFlow settings used lower PMT voltages, the robust CV values (orange line) and robust SDEN values (green line) are still in their plateau phases.
Figure 2
Figure 2
Overtime stability of Rainbow 8-peak bead mean fluorescence intensity (MFI) profile, illustrating the results obtained for three fluorescence channels: pacific blue (PacB) channel of the violet laser (blue dots); phycoerythrin (PE) channel of the red laser (yellow dots); and fluorescein isothiocyanate (FITC) channel of the green laser (green dots), for the same flow cytometer instrument upon long-term monitoring of MFI measurements for the brightest peak of the Rainbow 8-peak beads. As shown, faulty violet laser was recognized as a source for the decreased MFI values falling below 15% of the target MFI (boxes A and C). Acceptable±15% range for each channel are depicted by gray lines and a colored background. After a service visit and laser alignment, MFI values above 15% of the target MFI were detected (box B); thus, photomultiplier tube (PMT) voltages were adjusted at this time point manually (closed circles). Please note that by placement of instrument settings as per the cytometer setting & tracking (CS&T) module the PMT could be adjusted to correct for the violet laser failure (open circles) until the laser failed completely and was replaced.
Figure 3
Figure 3
Illustrating example of the differences in the light scatter characteristics of the major subsets of peripheral blood leukocytes observed for the distinct lysing solutions and staining protocols. Please note the significant reduction in the light scatter CV for the different leukocyte populations observed with FACS Lysing Solution and a SLW protocol (red square). Events shown in the upper-left corner of each dot plot correspond to PerfectCOUNT beads (Cytognos SL) introduced for the evaluation of cell loss. SLW, stain-lyse-wash; SLWF, stain-lyse-wash-fix; SLNW, stain-lyse-no wash.
Figure 4
Figure 4
Comparison of the absolute cell counts of major leukocyte populations (a) and lymphocyte subsets (b) obtained with the four different lysing solutions (FACS Lysing Solution, Ammonium Chloride, QuickLysis and VersaLyse Lysing Solution) evaluated in combination with the three different staining procedures (SLNW, SLW, SLWF) tested. Results are shown as mean values (open circles) and 95% confidence intervals (vertical lines). FACS Lyse, FACS Lysing Solution; NH4Cl, ammonium chloride; VersaLyse, VersaLyse Lysing Solution. SLW, stain-lyse-wash; SLWF, stain-lyse-wash-fix; SLNW, stain-lyse-no wash.
Figure 5
Figure 5
Comparison of the mean fluorescence intensity (MFI) values of six fluorochrome-conjugated antibodies obtained with the four different lysing solutions evaluated in combination with the three different staining procedures (SLNW, SLW, SLWF) tested. CD45-fluorescein isothiocyanate (FITC) was evaluated on total peripheral blood (PB) lymphocytes, CD14-allophycocyanin (APC) was evaluated on PB monocytes, CD4-peridinin chlorophyll protein cyanin5.5 (PerCPCy5.5) was evaluated on PB CD4+ T-lymphocytes, CD8-APC hilite7 (H7) on PB CD8hi T-lymphocytes and the two CD19-phycoerythrin cyanin 7 (PECy7) reagents were both evaluated on PB CD19+ B-lymphocytes. Results are shown as mean values (open circles) and 95% confidence intervals (vertical lines). FACS Lyse, FACS Lysing Solution; NH4Cl, ammonium chloride; VersaLyse, VersaLyse Lysing Solution. SLW, stain-lyse-wash; SLWF, stain-lyse-wash-fix; SLNW, stain-lyse-no wash.
Figure 6
Figure 6
Parameter band plot of all individual parameters evaluated in a bone marrow sample from an MDS patient treated according to the EuroFlow protocol with (light colors) or without (dark colors) prior bulk lysis. Colored circles represent median scatter and fluorescence intensity (MFI) values obtained for the lymphocytes (dark green/light green), monocytes (red/orange) and neutrophils (dark blue/light blue).
Figure 7
Figure 7
Effect of time between completion of staining and data acquisition in the flow cytometer (0 h, 1 h, 3 h and 24 h) and the sample preparation protocol on the mean fluorescence intensity (MFI) of CD19-phycoerythrin cyanin 7 (PECy7), CD4-peridinin chlorophyll protein cyanin5.5 (PerCPCy5.5) and CD8-allophycocyanin hilite7 (APCH7) on peripheral blood (PB) B-cells, CD4+ T-cells and CD8hi T-cells, using ammonium chloride (a) or FACS Lysing Solution (b) as lysing reagents. Three different sample preparation protocols were evaluated: SLNW; SLW and SLWF. Results are shown as mean values (open circles) and 95% confidence intervals (vertical lines). FACS Lyse, FACS Lysing Solution; NH4Cl, ammonium chloride. SLW, stain-lyse-wash; SLWF, stain-lyse-wash-fix; SLNW, stain-lyse-no wash.
Figure 8
Figure 8
Flow chart diagram illustrating the sequential steps used during data analysis for the evaluation of the performance of the EuroFlow antibody panels.
Figure 9
Figure 9
Data matrix obtained from the EuroFlow B-CLPD (B-cell chronic lymphoproliferative disorders) antibody panel, showing merging of five original data files into a single data file containing data about 29 parameters (2 scatter parameters and 27 markers). Columns correspond to the different B-CLPD tubes (sample aliquots) measured and rows correspond to the different parameters evaluated. ‘C' means ‘common' marker defined as measured in all aliquots; ‘R' means ‘real' data measured in any of the tubes. Blank spaces represent the parameter information that was not measured on an individual aliquot of the sample.
Figure 10
Figure 10
Schematic representation of the data calculation process with the Infinicyt software based on the ‘nearest neighbor' principle. First, one event from a cell population (B-cells highlighted in red) in a is identified in a first data file (tube 2 of B-cell chronic lymphoproliferative disorders (B-CLPD) panel) based on the backbone markers; then the event corresponding to the nearest neighbor of this event is identified in the second data file (right; tube 5 of B-CLPD panel) as that event occupying the same (closest) position in a multidimensional space formed by the same backbone parameters (b). Third, through the data calculation process the values for those parameters that were only measured for the later event in the second data file (d) but not for the former event in the first data file are assigned to the said event in the first data file and vice versa (c). Finally, the calculation process is completed for all other events in the cell population of interest (red events). Through this approach, all events in the merged and calculated data file have information about each of the parameters measured in both tubes (e).
Figure 11
Figure 11
Illustrating example of the impact of different sample preparation protocols on the immunophenotypic and light scatter features of lymphocytes from a normal peripheral blood (PB) sample (a) and blast cells from B-cell precursor acute lymphoblastic leukemia (BCP-ALL) (n=9; c) and how the harmonization process reduces such impact (b and d, respectively). In a and b, FSC versus SSC representation of duplicates of a sample stained with two different protocols (permeabilized versus non-permeabilized lymphocytes) is shown without (a) and with (b) data harmonization applied, respectively; in both a and b, green and violet populations correspond to non-permeabilized and permeabilized aliquots, respectively. In c and d, different BCP-ALL blast cell populations from nine different BCP-ALL patients each stained in five different aliquots with the BCP-ALL EuroFlow panel are displayed. Each population is represented as median values in a principal component (PC) 1 versus PC2 analysis diagram (automatic population separator (APS)1 view based on the discrimination obtained for the following parameters: FSC, SSC, CD19, CD34 and CD45), where paired duplicated samples are colored identically. In c samples contain both permeabilized and non-permeabilized aliquots within the panel and the harmonization process was applied for five patient samples (duplicates colored dark yellow, light green, dark violet, red and cyan) for which duplicates show a very close position in the APS1 view; conversely for the other pairs of duplicates (light yellow, dark green, violet, dark blue show greater differences between paired samples). In d, one group of duplicates was processed by permeabilizing all aliquots within the panel, while in the other group each sample contained permeabilized and non-permeabilized sample aliquots, with data harmonization being applied to the latter group; note that now all pairs of sample duplicates overlap, confirming that with data harmonization blast cell populations processed differently (permeabilized versus non-permeabilized) are highly comparable to those who underwent a uniform sample preparation protocol.
Figure 12
Figure 12
Example of principal component (PC1 versus PC2) analysis (PCA; automatic population separator (APS)1 views) for comparison of a new sample—red circles (median values) and dots—with a library of cases (median values/case represented as circles) from three different reference groups, each being colored differently (green, cyan and violet circles). In the upper panels the unknown case is compared to each pair of reference groups and it only overlaps systematically with the dark blue cases (ac). In the lower panels (df), the new sample is separately compared with each individual reference group, showing again a high degree of overlap with the dark blue reference cases (f). Contour lines in each panel correspond to one (inner line) and two (outer line) s.d.'s of the mean value of the corresponding group of reference cases.
Figure 13
Figure 13
Results of synchronized EuroFlow experiments performed on different centers and instruments. (a) Box plot representations of mean fluorescence intensity (MFI) values observed for all antigens evaluated in the eight gated subsets of peripheral blood (PB) monocytes and lymphocytes from 30 healthy donor PB samples. Results corresponding to a total of 30 merged data files are displayed. (b) Principal component (PC)1 versus PC2 view (automatic population separator (APS) 1 view) of individual cellular events of the cell populations depicted in a; the median values of each gated subset (circles) are color-coded as follows: B-cells, red; CD4+/CD27+ memory T-cells, light blue; CD4+/CD27 T-cells, dark blue; CD8hi/CD27+ memory T-cells, dark green; CD8hi/CD27 T-cells, light green; CD3+/CD4 and CD8 T-cells, violet; NK-cells, yellow and monocytes, orange. (c) APS1 view of a single stabilized peripheral blood sample measured in 8 different EuroFlow laboratories for illustration of intra-donor variability (color coding is the same as in b). In a, results are displayed as box plots, where the line in the middle represents median values, the upper and lower limits of the box represent the 75th and 25th percentiles, respectively, and the upper and lower ends of vertical lines represent the 95% confidence interval. In b, each population is represented as a circle surrounded by dots corresponding to median values of median expression for all immunophenotypic parameters measured and to individual cells, respectively.

References

    1. Swerdlow SH, Campo E, Harris NL, Jaffe ES, Pileri SA, Stein H, et al. WHO Classification of Tumours of Haematopoietic and Lymphoid Tissues4th edn.International Agency for Research on Cancer: Lyon; 2008. 439 pp.
    1. Davis BH, Holden JT, Bene MC, Borowitz MJ, Braylan RC, Cornfield D, et al. Bethesda International Consensus recommendations on the flow cytometric immunophenotypic analysis of hematolymphoid neoplasia: medical indications. Cytometry B Clin Cytom. 2007;72 (Suppl 1:S5–S13. - PubMed
    1. Wood BL, Arroz M, Barnett D, DiGiuseppe J, Greig B, Kussick SJ, et al. Bethesda International Consensus recommendations on the immunophenotypic analysis of hematolymphoid neoplasia by flow cytometry: optimal reagents and reporting for the flow cytometric diagnosis of hematopoietic neoplasia. Cytometry B Clin Cytom. 2007;72 (Suppl 1:S14–S22. - PubMed
    1. Stewart CC, Behm FG, Carey JL, Cornbleet J, Duque RE, Hudnall SD, et al. U.S.-Canadian Consensus recommendations on the immunophenotypic analysis of hematologic neoplasia by flow cytometry: selection of antibody combinations. Cytometry. 1997;30:231–235. - PubMed
    1. Stetler-Stevenson M, Ahmad E, Barnett D, Braylan R, DiGiuseppe J, Marti G, et al. Clinical Flow Cytometric Analysis of Neoplastic Hematolymphoid Cells. Approved guideline. 2nd edn. CLSI document H43-A2 ed. Clinical and Laboratory Standards Institute: Wayne, PA, 2007.

Publication types