. 2012 Sep;68(Pt 9):1108-17.
doi: 10.1107/S0907444912021361. Epub 2012 Aug 18.

Spatial distribution of radiation damage to crystalline proteins at 25-300 K

Affiliations

Spatial distribution of radiation damage to crystalline proteins at 25-300 K

Matthew Warkentin et al. Acta Crystallogr D Biol Crystallogr. 2012 Sep.

Abstract

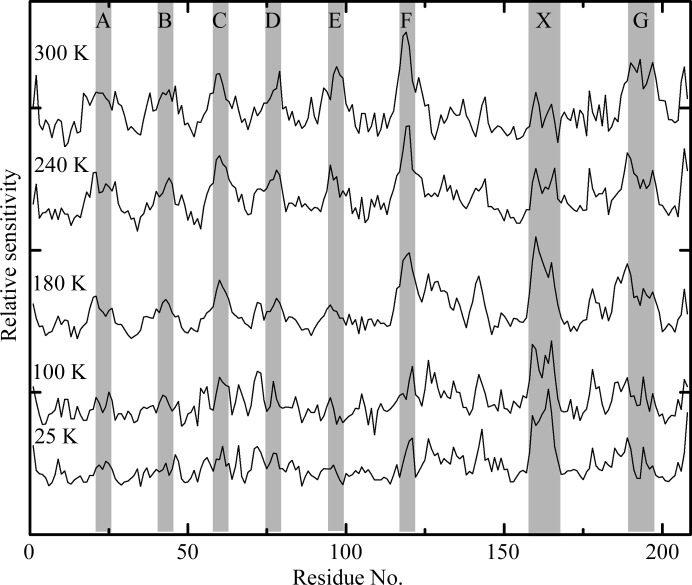
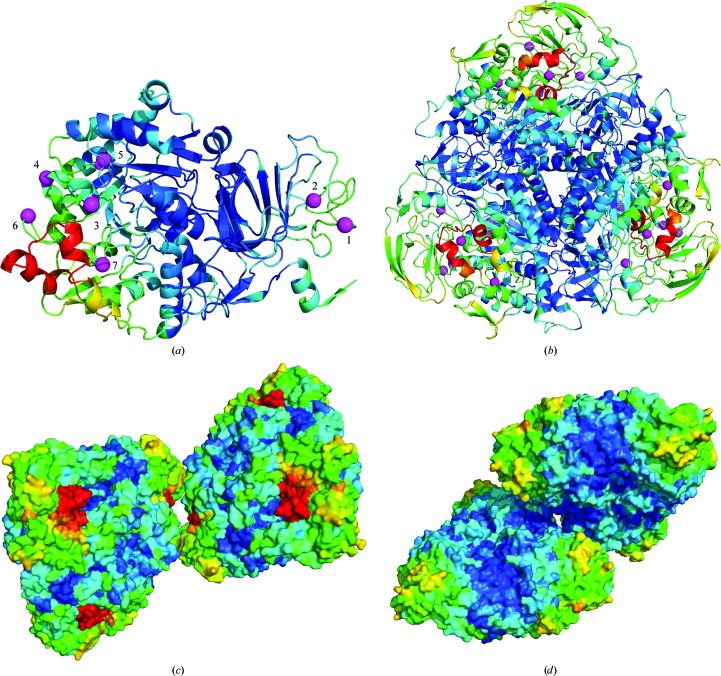
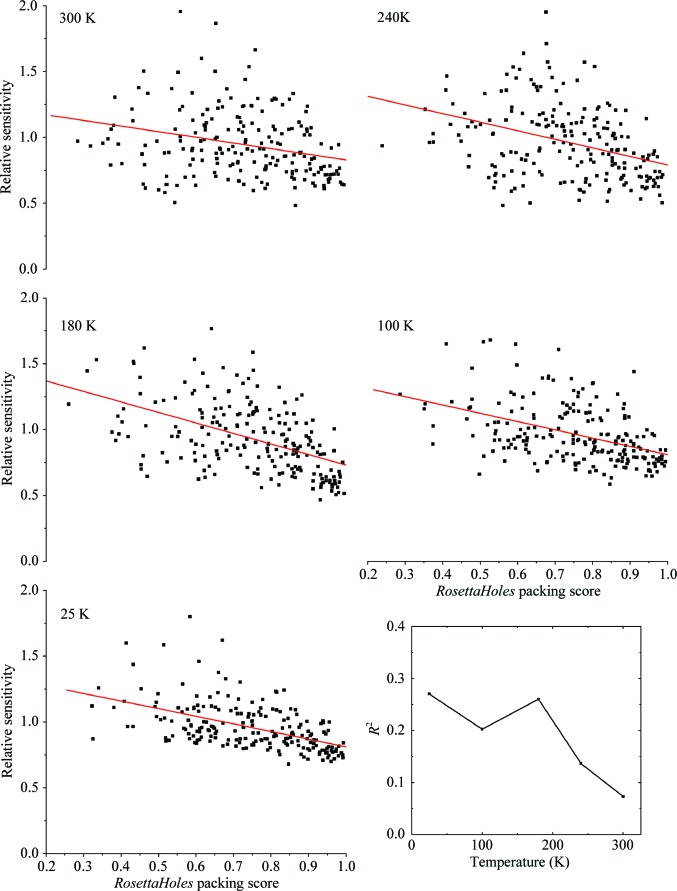
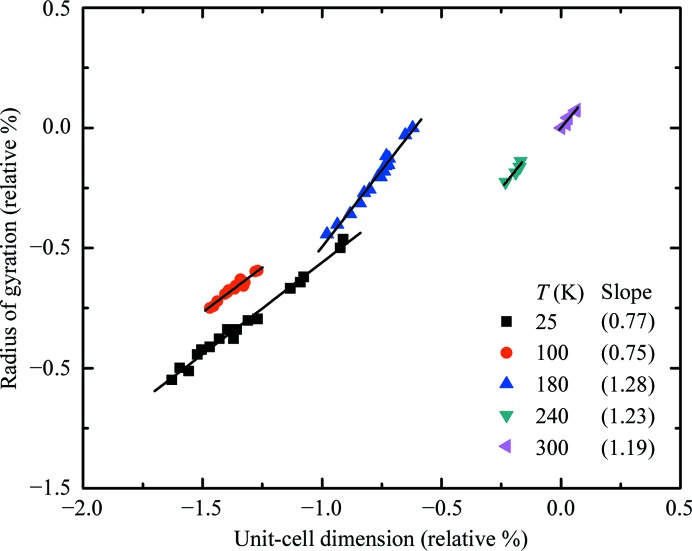
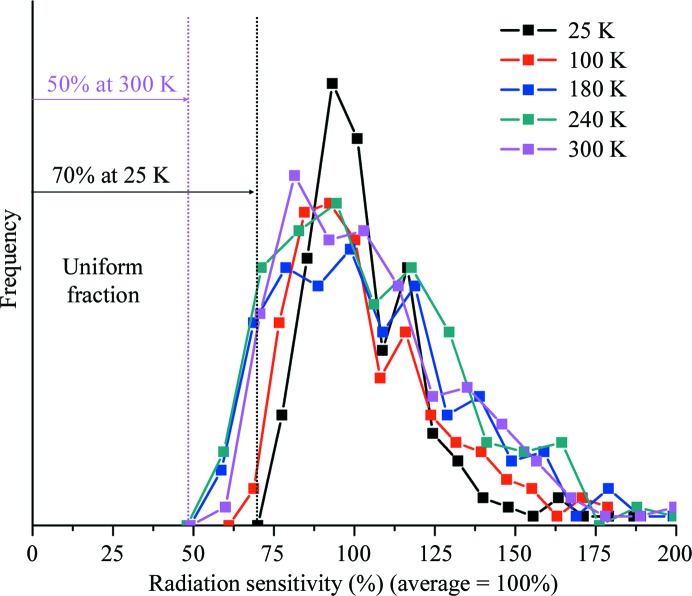
The spatial distribution of radiation damage (assayed by increases in atomic B factors) to thaumatin and urease crystals at temperatures ranging from 25 to 300 K is reported. The nature of the damage changes dramatically at approximately 180 K. Above this temperature the role of solvent diffusion is apparent in thaumatin crystals, as solvent-exposed turns and loops are especially sensitive. In urease, a flap covering the active site is the most sensitive part of the molecule and nearby loops show enhanced sensitivity. Below 180 K sensitivity is correlated with poor local packing, especially in thaumatin. At all temperatures, the component of the damage that is spatially uniform within the unit cell accounts for more than half of the total increase in the atomic B factors and correlates with changes in mosaicity. This component may arise from lattice-level, rather than local, disorder. The effects of primary structure on radiation sensitivity are small compared with those of tertiary structure, local packing, solvent accessibility and crystal contacts.


Figures

Figure 1
Figure 1
Relative sensitivities of each residue in thaumatin versus residue number along the amino-acid chain. Data at different temperatures are offset and scaled. Note the ‘ripple’ pattern at 180, 240 and 300 K marked by the letters A–G and the feature at 25, 100 and 180 K marked by an X.
Figure 2
Figure 2
Thaumatin structure with residues colored according to their radiation sensitivity at T = 300 K, with blue being least sensitive and red most sensitive. The same colour scale is used for urease in Fig. 4 ▶, which has residues showing much larger relative sensitivity than those of thaumatin. The features marked A–G and X match those in Fig. 1 ▶. These visualizations were created with PyMOL (http://www.pymol.org).
Figure 3
Figure 3
Relative radiation sensitivities for each residue in urease at T = 100 and 300 K. The active-site flap is the most sensitive part of the structure at both temperatures. The B chain shows enhanced sensitivity at 300 K. The ‘ripple’ pattern in the C chain at 300 K (with peak positions denoted by magenta balls) is related to the proximity of the chain to the active-site flap (see Fig. 4 ▶). The spacing in residues between each ripple is much larger than for the ripples in thaumatin. This reflects the larger overall fold of the urease C chain and demonstrates the connection between the ripples and tertiary structure. The C chain is largely buried in the contacts that form the trimer-of-trimers unit present in the crystal and in the biological form (Karplus et al., 1997 ▶).
Figure 4
Figure 4
Urease structure with residues colored according to their radiation sensitivity at 300 K. (a) The C chain, with magenta balls indicating positions of the peaks of the ‘ripples’ in Fig. 3 ▶. Five of the balls are near the active-site flap (red), while the other two are near a copy of the flap in the trimer-of-trimers unit (b). The B chain is both solvent-exposed and near the flap, which may explain its enhanced sensitivity at 300 K. (c) A crystal contact between two symmetry-related copies of the flap (each in a different copy of the biological unit) is shown. (d) A second crystal contact located on the other side of the trimer-of-trimers unit as the flap. These visualizations were created with PyMOL (http://www.pymol.org).
Figure 5
Figure 5
Relative variation in the average sensitivity of residues by residue type for thaumatin and urease at T = 100 and 300 K. (Data at other temperatures are omitted for clarity.) Average sensitivities are obtained by averaging over all residues in each protein of the same type and show some systematic variation. Error bars represent the variability between residues of the same type and are comparable in size with the variability between residue types. Consequently, most residue-to-residue variation in sensitivity along the chain cannot be explained by primary structure.
Figure 6
Figure 6
Relative sensitivity of each residue in thaumatin crystals versus the packing score for each residue from RosettaHoles. The solid lines show the result of a linear regression analysis, and R 2 for the analysis at each temperature is shown in the inset at the lower right. At T = 25, 100 and 180 K approximately 25% of the variability in sensitivity can be explained by differences in local packing. The correlation diminishes at 240 and 300 K, presumably because other effects become more important.
Figure 7
Figure 7
Variation of the molecular radius of gyration and the unit-cell dimension with dose for thaumatin crystals at several temperatures. Both quantities are expressed as relative percentages of their values from the first data set (lowest total accumulated dose) at 300 K. Solid lines indicate linear regression fits at each temperature and the resulting slopes are given in the legend. As total accumulated dose grows both quantities increase at all temperatures, but the relative rate of increase of the radius of gyration is larger at lower temperatures.
Figure 8
Figure 8
Histograms of the sensitivities of the individual residues (relative to the average over all residues) in thaumatin at several temperatures. At lower temperatures the distribution of sensitivities is narrower and has a larger minimum. The sensitivity of the least sensitive residue can be interpreted as giving the component of damage that is uniform across the unit cell. In this interpretation 50% of damage is uniform at 180, 240 and 300 K, increasing to 60% at 100 K and 70% at 25 K.

Similar articles

Cited by

References

    1. Adams, P. D. et al. (2011). Methods, 55, 94–106. - PubMed
    1. Alphey, M. S., Gabrielsen, M., Micossi, E., Leonard, G. A., McSweeney, S. M., Ravelli, R. B., Tetaud, E., Fairlamb, A. H., Bond, C. S. & Hunter, W. N. (2003). J. Biol. Chem. 278, 25919–25925. - PubMed
    1. Audette, M., Chen, X., Houée-Levin, C., Potier, M. & Le Maire, M. (2000). Int. J. Radiat. Biol. 76, 673–681. - PubMed
    1. Barker, A. I., Southworth-Davies, R. J., Paithankar, K. S., Carmichael, I. & Garman, E. F. (2009). J. Synchrotron Rad. 16, 205–216. - PubMed
    1. Benkovic, S. J. & Hammes-Schiffer, S. (2006). Science, 312, 208–209. - PubMed

Publication types