. 2012 Nov;30(11):2535-47.
doi: 10.1002/stem.1213.

Mitochondrial superoxide production negatively regulates neural progenitor proliferation and cerebral cortical development

Affiliations

Mitochondrial superoxide production negatively regulates neural progenitor proliferation and cerebral cortical development

Yan Hou et al. Stem Cells. 2012 Nov.

Abstract

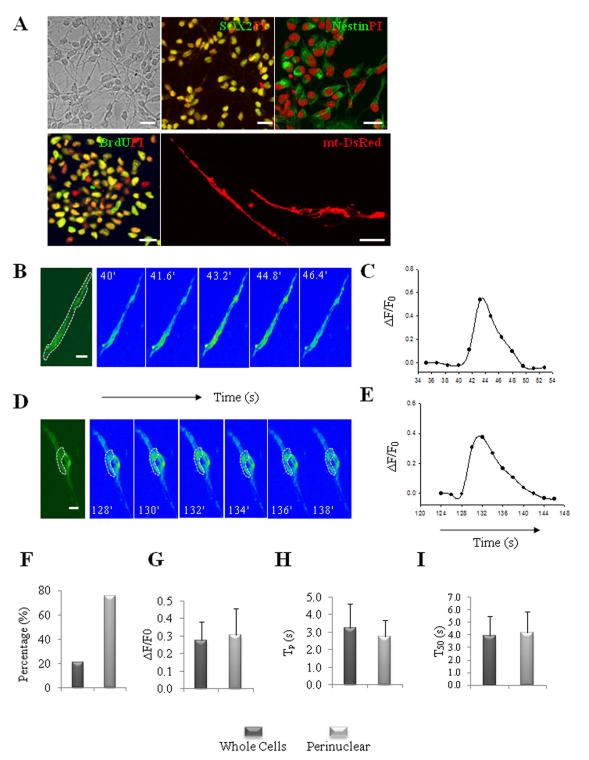
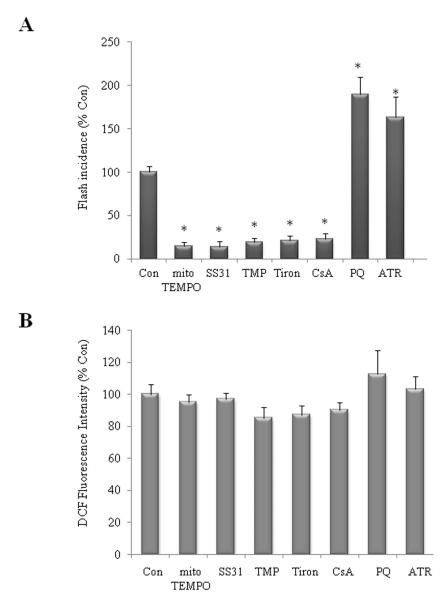
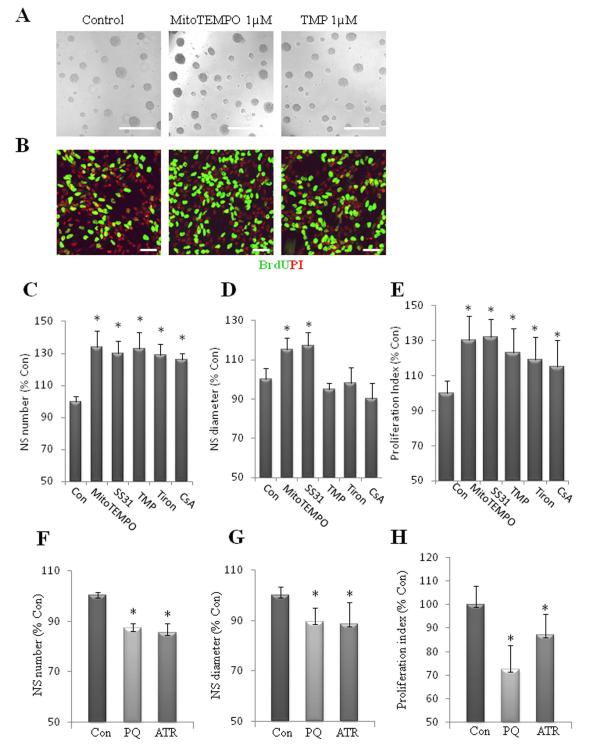
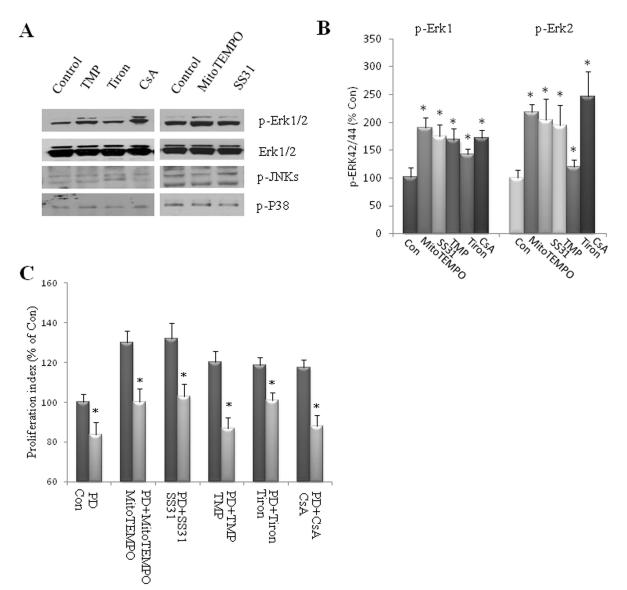
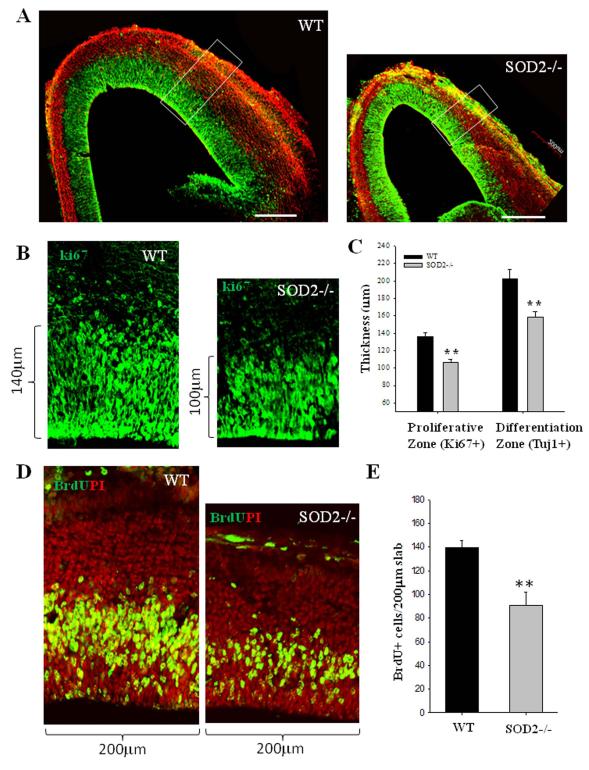
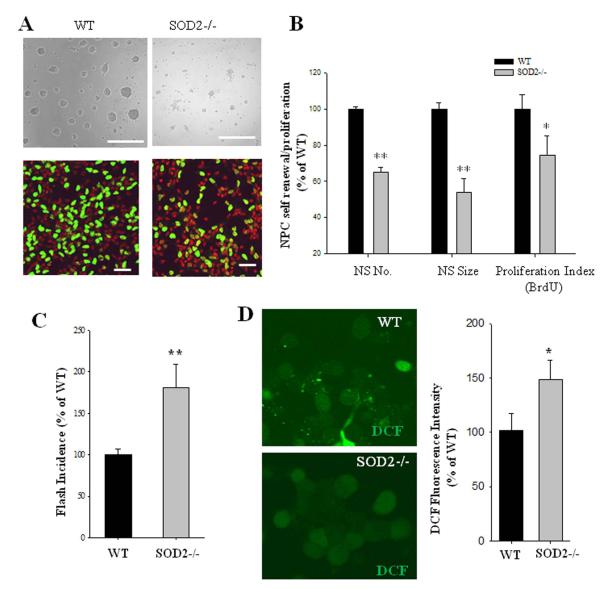
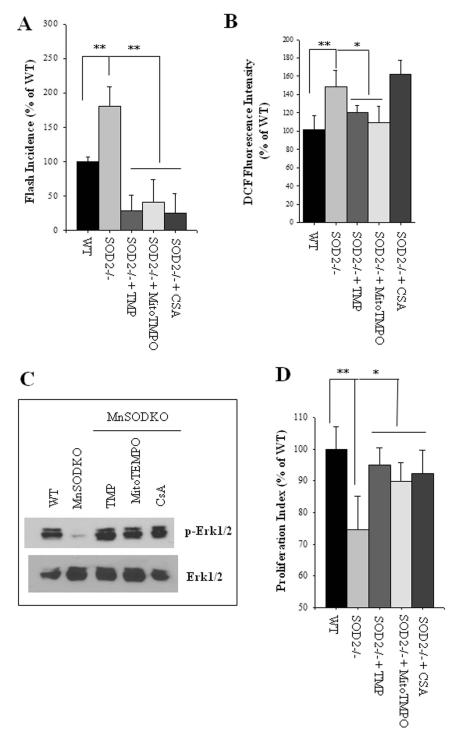
Although high amounts of reactive oxygen species (ROS) can damage cells, ROS can also play roles as second messengers, regulating diverse cellular processes. Here, we report that embryonic mouse cerebral cortical neural progenitor cells (NPCs) exhibit intermittent spontaneous bursts of mitochondrial superoxide (SO) generation (mitochondrial SO flashes) that require transient opening of membrane permeability transition pores (mPTP). This quantal SO production negatively regulates NPC self-renewal. Mitochondrial SO scavengers and mPTP inhibitors reduce SO flash frequency and enhance NPC proliferation, whereas prolonged mPTP opening and SO generation increase SO flash incidence and decrease NPC proliferation. The inhibition of NPC proliferation by mitochondrial SO involves suppression of extracellular signal-regulated kinases. Moreover, mice lacking SOD2 (SOD2-/- mice) exhibit significantly fewer proliferative NPCs and differentiated neurons in the embryonic cerebral cortex at midgestation compared with wild-type littermates. Cultured SOD2-/- NPCs exhibit a significant increase in SO flash frequency and reduced NPC proliferation. Taken together, our findings suggest that mitochondrial SO flashes negatively regulate NPC self-renewal in the developing cerebral cortex.


Figures

Figure 1
Figure 1
Characterization of spontaneous mitochondrial SO flashes in NPCs. (A): Dissociated NPCs at day 3 in culture were immunostained with antibodies against Sox2, nestin and BrdU (after a 16 h exposure to 10 μM BrdU) (green), which are markers of proliferating NPCs. The nuclei of NPCs were counterstained with propidium iodide (red). The image at the lower right shows NPCs transfected with an mt-DsRed plasmid to illustrate the mitochondrial morphology in NPCs. Bar = 20 μm. (B-E): Characteristics of mitochondrial SO flashes in NPCs. Time-lapse images of SO flashes in NPCs (B, D) and results of quantification of mt-cpYFP fluorescence intensity before, during and after a SO flash (C, E); the bipolar NPC in panel B exhibited a flash that occurred in all mitochondria throughout the cell, and the rounded cell in panel D exhibited a flash only in perinuclear mitochondria. Bar = 5 μm. (F): Percentages of NPCs exhibiting whole-cell and perinuclear flashes. (G-I): Distribution and kinetics of whole-cell and perinuclear SO flashes in NPCs. ΔF/F0 is the amplitude of SO flashes where F0 refers to basal fluorescence intensity (G); Tp is the time to peak fluorescence intensity (H); and T50 is 50% decay time after the peak (I). Values are the mean ± SD (n = 17–63 SO flashes analyzed).
Figure 2
Figure 2
Mitochondrial SO flash activities are modified by SO scavengers/donors and mPTP inhibitor/opener and doesn′t contribute appreciably to global ROS. (A): Mitochondrial SO flashes are suppressed by treatment of NPCs with mitochondrial SO scavengers (MitoTEMPO 1μM and SS31 50μM), the SO mimetic agent (TMP 1 μM), a SO scavenger (Tiron 100 μM) and an inhibitor of mPTP (CsA 0.1 μM). Mitochondrial SO flashes are enhanced by treatment of SO generator (PQ1 μM), mPTP opener (ATR 1 μM). NPCs were treated for 24 h (n = 3 separate experiments; ~100 cells imaged in each experiment). *p<0.05. (B): Global ROS levels in NPCs measured by DCF loading were not altered by different treatment as indicated that either suppressed or enhanced SO flash activity. Values are the mean ± SD (n = 3 separate experiments). *p<0.05.
Figure 3
Figure 3
Superoxide flashes negatively regulate NPC proliferation. (A): Images of neurospheres in cultures which had been treated for 6 d with vehicle (Control) or 1 μM MitoTEMPO, 1 μM TMP. Bar = 500 μm. (B): Images of dissociated adherent NPCs in cultures which had been treated as indicated in (A). The NPC were then incubated for 2 h in the presence of BrdU (10 μM), fixed and immunostained with antibodies against BrdU (green) and propidium iodide (PI; red). Bar = 40 μm. (C, D): Results of quantification of neurosphere number (C) and diameter (D) in cultures maintained for 6 d in the presence of MitoTEMPO 1μM, SS31 50μM, TMP 1 μM, Tiron 100 μM and CsA 0.1 μM. (E): Quantitative analysis of proliferation index (BrdU+ cells/total cells) in dissociated NPC cultures treated for 24 h with the indicated treatments in (C) and (D). (F, G): Results of quantification of neurosphere number (F) and diameter size (G) in cultures maintained for 6 d in the presence of 1 μM PQ or 1 μM ATR. (H): Quantitative analysis of proliferation index (BrdU+ cells/total cells) in dissociated NPC cultures treated for 24 h with the indicated treatments. Values are expressed as a percentage of the mean of the control condition (n = 3 separate experiments) *p<0.05.
Figure 4
Figure 4
Suppression of superoxide flash promotes ERK1/2 phosphorylation. (A, B): Dissociated adherent NPCs were treated with 1μM MitoTEMPO, 50μM SS31, 1 μM TMP, 100 μM Tiron or 0.1 μM CsA for 24 h. Immunoblot analysis using antibodies that selectively recognize phosphorylated (active) forms of ERKs 1 and 2, p38 or JNK. Blots were reprobed with phosphorylation-insensitive antibodies against ERKs 1 and 2. Panel A show representative blots and panels B show results of densitometric analysis of 4-6 blots. *p<0.05 compared to the control value. (C): Quantitative analysis of proliferation index (BrdU+ cells/total cells) in dissociated NPC cultures which were pretreated for 1 h with PD98059 20 μM, and were then treated for 24 h with vehicle (con), 1μM MitoTEMPO, 50 μM SS31, 1 μM TMP, 100 μM Tiron or 0.1 μM CsA. *p<0.05 compared to the corresponding value for cultures treated without PD98059.
Figure 5
Figure 5. SOD2 deficiency results in a significant reduction in the size of the proliferative zone and NPC proliferation in the embryonic cerebral cortex
(A): Representative confocal images showing Ki67 (green) and Tuj1 (red) immunoreactive cells in brain sections from E14.5 wild type and SOD2−/− littermate embryos, taken from matched sections at the same level of the frontal cortex. (B): representative higher-magnification confocal images of a 200 μm slab of the middle telencephalon wall as indicated in (A) are shown with Ki67 (green) staining. (C): The combination of Ki67 (proliferation marker) and Tuj1 (a marker of differentiated neurons) delineates the zones of cell proliferation and differentiation (A). The thicknesses of proliferative zone (Ki67+) and differentiation zone (Tuj1+) were quantified and values represent the mean ± SD of analyses performed on brain sections from 3 WT and 3 SOD2−/− mice. *p<0.05 and **p<0.001. (D): Representative confocal images of a 200 μm slab of the middle telecencephalon wall of WT and SOD2−/− littermate mice at E14.5 immunostained with BrdU (green) and propidium iodide (PI; red). Pregnant dams at E14.5 were pulse (1h) labeled with BrdU, and brain sections were immunostained with BrdU (green) and counterstained with PI (red). (E): Total BrdU+ cells within a 200 μm slab of the middle telecencephalon wall of WT and SOD2−/− littermate mice were quantified. Values represent the mean ± SD of analyses performed on brain sections from 3 WT and 3 SOD2−/− mice. **p<0.01.
Figure 6
Figure 6. NPCs lacking SOD2−/− exhibit increased mitochondrial SO flash incidence and a reduction of cell proliferation
(A): Representative images of neurospheres in cultures prepared from E14.5 cerebral cortex of WT and SOD2−/− littermate mice, and representative images of dissociated adherent NPCs in cultures which were incubated for 2 h in the presence of BrdU (10 μM), fixed and immunostained with antibodies against BrdU (green) and PI (red). Bar = 40 μm. (B): Results of quantification of neurosphere number, diameter size and proliferation index (BrdU+ cells/total cells) in dissociated NPC cultures established from WT and SOD2−/− mice. Values are expressed as a percentage of the mean of the control condition (n = 8 pairs of WT and SOD2−/− NPC cultures. *p<0.05 and **p<0.01. (C): mitochondrial superoxide flashes are enhanced in SOD2−/− NPC in comparison to that of WT. NPCs were imaged on culture day 3 (n = 3 pairs of littermate NPC cultures; ~100 cells imaged in each experiment). **p<0.01. (D): Global ROS levels in NPCs measured by DCF loading were also increased. Representative images of DCF fluorescence in WT and SOD2−/− NPC are shown, and the quantitative data of DCF fluorescence intensity are expressed as the percentage of the WT control levels. Values are the mean ± SD (n = 3 separate experiments). **p<0.01.
Figure 7
Figure 7. Mitochondrial mPTP-dependent bursts of SO production mediate impaired proliferation of NPC caused by SOD2−/− deficiency
(A): Dissociated adherent NPCs from SOD2−/− mice were treated for 6 h with 1μM TMP, 1μM MitoTEMPO, or 0.1μM CsA. Results show analysis of SO flash incidence (number of NPCs which exhibited a mitochondrial SO flash among ~150 cells imaged for 3 minutes). (B): Global ROS levels in NPCs measured using the probe DCF. (C): Immunoblot of p-ERK1/2 and total ERK1/2 in cortical NPCs from wild type mice (WT) or Mn-SOD deficient mice (MnSODKO) that had been treated for 6 h with 1 μM TMP, 1μM MitoTEMPO or 0.1μM CsA. p-ERK1/2 levels were reduced in NPCs lacking SOD2 and treatment with TMP, MitoTEMPO and CsA restored p-ERK levels. (D): Results of quantification of proliferation index (BrdU+ cells/total cells) in dissociated NPC cultures from WT and SOD2−/− mice. NPCs were treated for 24 h with 1 μM TMP, 1μM MitoTEMPO, 0.1μM CsA, or vehicle control. All data in A-C are plotted as the percentage of WT control. *p<0.05 and **p<0.01 WT compared to SOD2−/−, or treatment compared to vehicle control.

References

    1. Day BJ. Catalase and glutathione peroxidase mimics. Biochem Pharmacol. 2009;77:285–296. - PMC - PubMed
    1. Mattson MP, Gleichmann M, Cheng A. Mitochondria in neuroplasticity and neurological disorders. Neuron. 2008;60:748–766. - PMC - PubMed
    1. Halestrap AP, Kerr PM, Javadov S, et al. Elucidating the molecular mechanism of the permeability transition pore and its role in reperfusion injury of the heart. Biochim Biophys Acta. 1998;1366:79–94. - PubMed
    1. Lin MT, Beal MF. Mitochondrial dysfunction and oxidative stress in neurodegenerative diseases. Nature. 2006;443:787–795. - PubMed
    1. Goldhaber JI, Qayyum MS. Oxygen free radicals and excitation-contraction coupling. Antioxid Redox Signal. 2000;2:55–64. - PubMed

Publication types

MeSH terms