. 2012 Oct;60(4):1006-15.
doi: 10.1161/HYPERTENSIONAHA.112.199661. Epub 2012 Sep 4.

Transcriptional upregulation of α2δ-1 elevates arterial smooth muscle cell voltage-dependent Ca2+ channel surface expression and cerebrovascular constriction in genetic hypertension

Affiliations

Transcriptional upregulation of α2δ-1 elevates arterial smooth muscle cell voltage-dependent Ca2+ channel surface expression and cerebrovascular constriction in genetic hypertension

John P Bannister et al. Hypertension. 2012 Oct.

Abstract

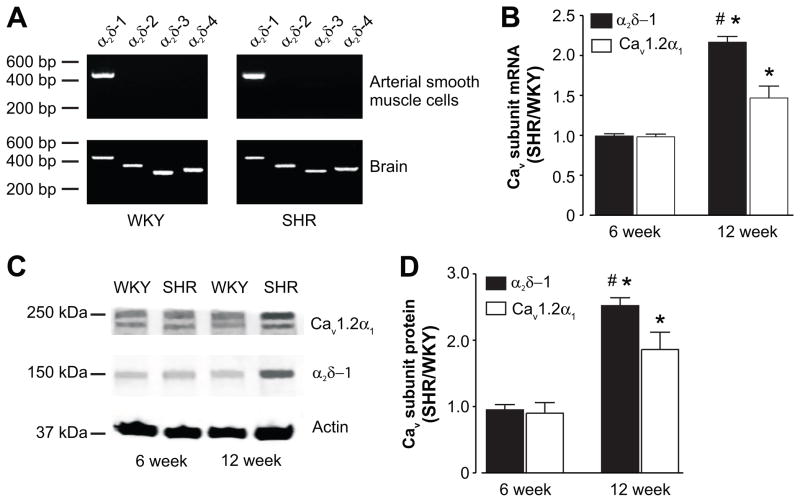
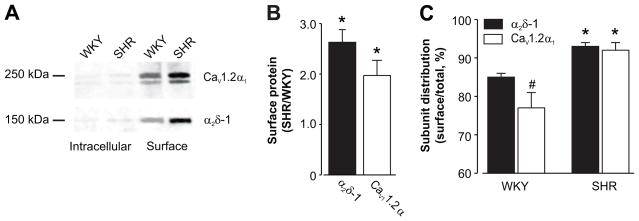
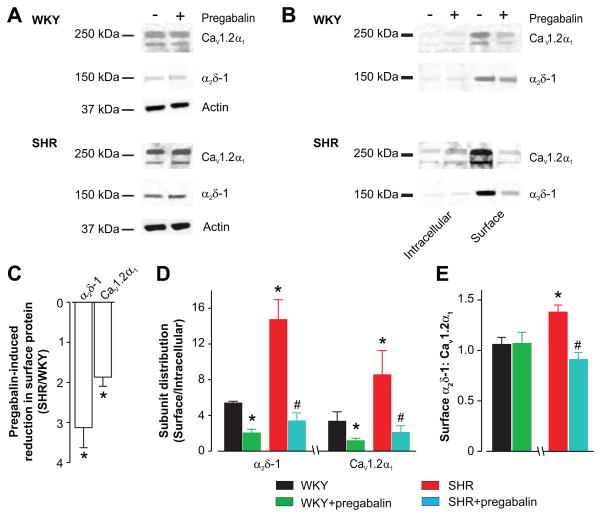
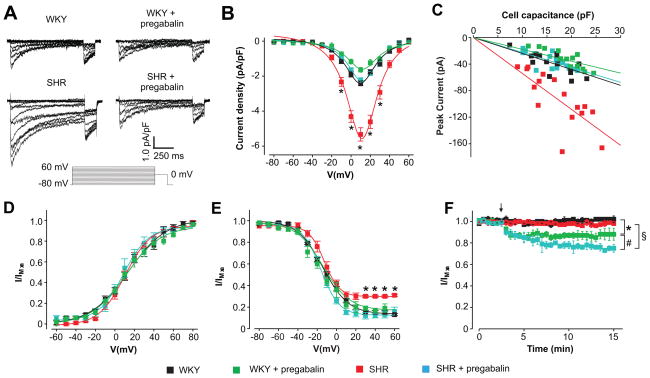
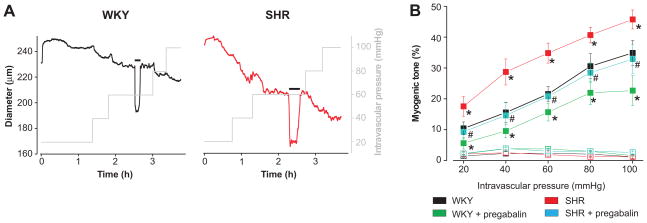
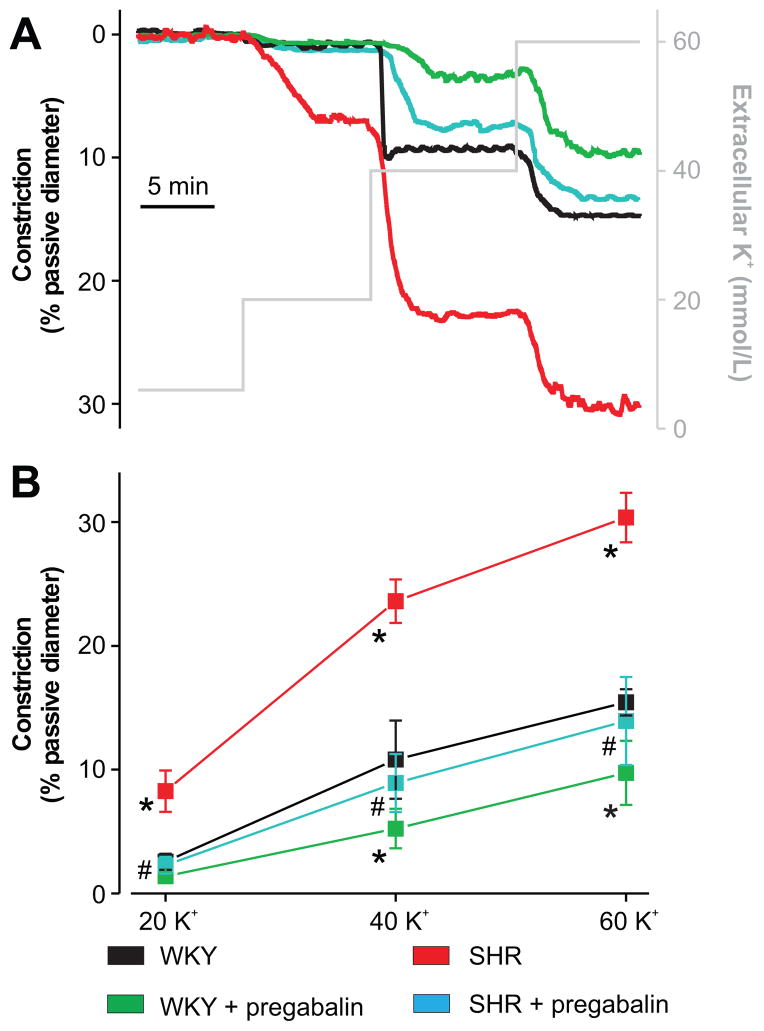
A hallmark of hypertension is an increase in arterial myocyte voltage-dependent Ca2+ (CaV1.2) currents that induces pathological vasoconstriction. CaV1.2 channels are heteromeric complexes composed of a pore-forming CaV1.2α1 with auxiliary α2δ and β subunits. Molecular mechanisms that elevate CaV1.2 currents during hypertension and the potential contribution of CaV1.2 auxiliary subunits are unclear. Here, we investigated the pathological significance of α2δ subunits in vasoconstriction associated with hypertension. Age-dependent development of hypertension in spontaneously hypertensive rats was associated with an unequal elevation in α2δ-1 and CaV1.2α1 mRNA and protein in cerebral artery myocytes, with α2δ-1 increasing more than CaV1.2α1. Other α2δ isoforms did not emerge in hypertension. Myocytes and arteries of hypertensive spontaneously hypertensive rats displayed higher surface-localized α2δ-1 and CaV1.2α1 proteins, surface α2δ-1:CaV1.2α1 ratio, CaV1.2 current density and noninactivating current, and pressure- and depolarization-induced vasoconstriction than those of Wistar-Kyoto controls. Pregabalin, an α2δ-1 ligand, did not alter α2δ-1 or CaV1.2α1 total protein but normalized α2δ-1 and CaV1.2α1 surface expression, surface α2δ-1:CaV1.2α1, CaV1.2 current density and inactivation, and vasoconstriction in myocytes and arteries of hypertensive rats to control levels. Genetic hypertension is associated with an elevation in α2δ-1 expression that promotes surface trafficking of CaV1.2 channels in cerebral artery myocytes. This leads to an increase in CaV1.2 current-density and a reduction in current inactivation that induces vasoconstriction. Data also suggest that α2δ-1 targeting is a novel strategy that may be used to reverse pathological CaV1.2 channel trafficking to induce cerebrovascular dilation in hypertension.


Conflict of interest statement

Conflict of Interest/Disclosures

None.

Figures

Figure 1
Figure 1
α2δ-1 and CaV1.2α1 subunit mRNA and protein are elevated in hypertension. A, Representative gel (of 3 experiments) illustrating RT-PCR amplification of transcripts for α2δ-1 through -4 in isolated arterial myocytes and whole brain of 12 week old WKY and SHR rats. B, Mean quantitative PCR data for α2δ-1 and CaV1.2α1 mRNA in 6 (n=8 for each) and 12 (n=6 for each) week old SHR rat arteries normalized to Rps5 and then to age-matched WKY controls. C, Exemplar Western blot illustrating α2δ-1 and CaV1.2α1 protein from 6 and 12 week old WKY and SHR rat whole arterial lysate. Blots were physically cut at 75 kDa to allow probing for actin and α2δ-1/CaV1.2α1. D, Mean data illustrating that α2δ-1 and CaV1.2α1 proteins are elevated in hypertension. * indicates P<0.05 when compared with the respective mRNA/protein at 6 weeks, # indicates P<0.05 when compared with CaV1.2α1 mRNA/protein at 12 weeks (n=8 for each protein at each age).
Figure 2
Figure 2
Arterial surface α2δ-1 and CaV1.2α1 subunits are elevated in hypertension. A, Representative Western blot illustrating increased surface expression of both α2δ-1 and CaV1.2α1 proteins in 12 week old WKY and SHR arteries. Blot was physically cut at 75 kDa to allow probing for α2δ-1 and CaV1.2α1. B, Mean data illustrate that surface levels of α2δ-1 and CaV1.2α1 subunits are higher in arteries during hypertension. C, Mean data illustrating the percentage of total (surface + intracellular) α2δ-1 and CaV1.2α1 proteins located at the surface * indicates P<0.05 versus same protein in age-matched WKY rat arteries, # indicates P<0.05 when compared with WKY α2δ-1 (n=5 – 9 each for WKY and SHR).
Figure 3
Figure 3
Pregabalin reduces surface expression of α2δ-1 and CaV1.2α1 channel proteins more effectively in arteries of hypertensive rats than in controls. A, Representative Western blot illustrating that pregabalin does not change total (whole arterial) α2δ-1 and CaV1.2α1 proteins in WKY and SHR arteries. B, Representative Western blots illustrating pregabalin (24 h)-induced changes in surface and intracellular α2δ-1 and CaV1.2α1 proteins. Blots were cut at 75 kDa to allow probing for α2δ-1 and CaV1.2α1. C, Pregabalin reduced surface α2δ-1 and CaV1.2α1 proteins more in SHR than WKY arteries. D, Mean data illustrating α2δ-1 and CaV1.2α1 subunit distribution in WKY and SHR arteries and regulation by pregabalin. E, Surface α2δ-1 to CaV1.2α1 and modulation by pregabalin. Pregabalin concentration in all figures was 100 μmol/L. * indicates P<0.05 compared with untreated WKY and # indicates P<0.05 versus untreated SHR rat arteries (n=4–5 each for untreated and pregabalin-treated WKY and SHR).
Figure 4
Figure 4
Pregabalin reverses elevated CaV1.2 currents in hypertensive rat arterial smooth muscle cells. A, Representative CaV1.2 current density recordings from control and pregabalin-treated WKY and SHR arterial smooth muscle cells (10 mmol/L Ba2+ as charge carrier). B, Mean current density-voltage relationships of WKY (n=17), pregabalin-treated WKY (n=13), SHR (n=16) and pregabalin-treated SHR (n=18) cells. C, Scatter plot with linear fit for peak CaV1.2 current versus cell capacitance in WKY (n=17), pregabalin-treated WKY (n=13), SHR (n=16) and pregabalin-treated SHR (n=18) cells. WKY: slope=−2.40, r=−0.76, p=3.3×10⁻⁴. WKY+pregabalin: slope=−1.79, r=−0.90, p=7.5×10⁻⁴. SHR: slope=−5.41, r=−0.77, p=3.5×10⁻⁴. SHR+pregabalin: slope=−2.25, r=−0.72, p=1.1×10⁻⁴. D, Voltage-dependent CaV1.2 current activation in WKY (n=13), pregabalin-treated WKY (n=9), SHR (n=12) and pregabalin-treated SHR (n=6) cells. E, Voltage-dependent current inactivation of WKY (n=17), pregabalin-treated WKY (n=13), SHR (n=16) and pregabalin-treated SHR (n=18) cells. *indicates significance from WKY at indicated potentials (P<0.05). F, Graph illustrating the time course of CaV1.2 currents (at +20 mV) and inhibition by acute pregabalin (100 μmol/L). WKY (control n=8, pregabalin n=9), SHR (control n=14, pregabalin n=6) cells. The arrow (not applicable for controls) indicates where pregabalin was added. Pregabalin concentration in all figures was 100 μmol/L. * indicates P<0.05 when compared to untreated WKY, # indicates P<0.05 when compared to pregabalin-treated WKY and § indicates P<0.05 when compared to untreated SHR.
Figure 5
Figure 5
Pregabalin reverses elevated pressure-induced vasoconstriction in hypertension. A, Representative traces illustrating steady-state myogenic tone in response to increasing intravascular pressure in a WKY (black) and SHR (red) artery. Horizontal black bars indicate an increase in bath K+ from 6 to 60 mmol/L. B Pregabalin (24 h, 100 μmol/L) reduced pressure (20 – 100 mmHg)-induced myogenic tone (filled symbols) more so in arteries from hypertensive rats than in controls. Myogenic tone was abolished by nimodipine (1 μmol/L, empty symbols). Mean data (n: WKY, 6–10; WKY + pregabalin, 6–9; SHR, 6–10; SHR+pregabalin, 6–7). * indicates P<0.05 when compared with untreated WKY and # indicates P<0.05 for SHR+pregabalin when compared with untreated SHR.
Figure 6
Figure 6
Pregabalin reverses elevated depolarization-induced vasoconstriction in hypertension. A, Representative traces illustrating diameter responses to increasing extracellular K+. B, Pregabalin (24 h, 100 μmol/L) reduced depolarization (20, 40, and 60 mmol/L K+)-induced vasoconstriction more so in arteries from hypertensive rats than controls. Mean data (n: WKY, 6; WKY + pregabalin, 6; SHR, 6; SHR + pregabalin, 6). * indicates P<0.05 when compared with untreated WKY, and # indicates P<0.05 for SHR + pregabalin when compared with untreated SHR.

Comment in

References

    1. Schmieder RE. End organ damage in hypertension. Dtsch Arztebl Int. 2010;107:866–873. - PMC - PubMed
    1. Wilde DW, Furspan PB, Szocik JF. Calcium current in smooth muscle cells from normotensive and genetically hypertensive rats. Hypertension. 1994;24:739–746. - PubMed
    1. Cox RH, Lozinskaya IM. Augmented calcium currents in mesenteric artery branches of the spontaneously hypertensive rat. Hypertension. 1995;26:1060–1064. - PubMed
    1. Jaggar JH. Intravascular pressure regulates local and global Ca2+ signaling in cerebral artery smooth muscle cells. Am J Physiol. 2001;281:C439–C448. - PubMed
    1. Gollasch M, Nelson MT. Voltage-dependent Ca2+ channels in arterial smooth muscle cells. Kidney Blood Press Res. 2000;20:355–371. - PubMed

Publication types

MeSH terms