. 2012 Sep 18;109(38):15366-71.
doi: 10.1073/pnas.1208976109. Epub 2012 Sep 4.

Energetics of life on the deep seafloor

Affiliations

Energetics of life on the deep seafloor

Craig R McClain et al. Proc Natl Acad Sci U S A. .

Abstract

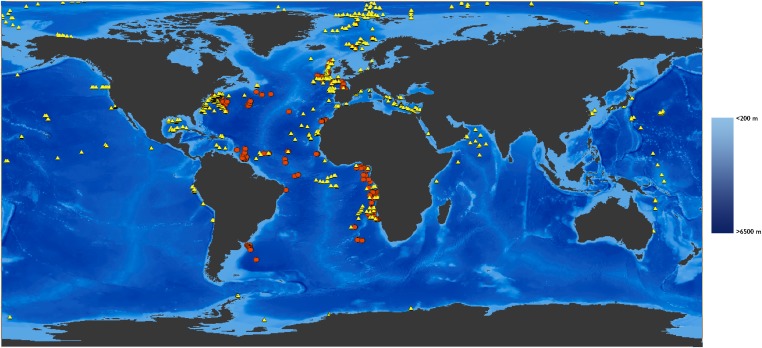
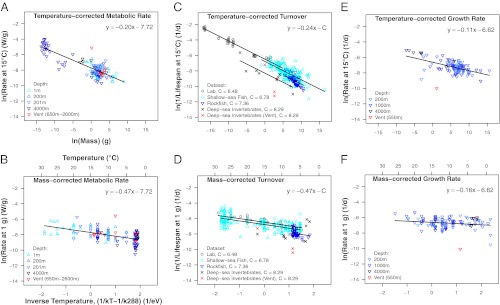
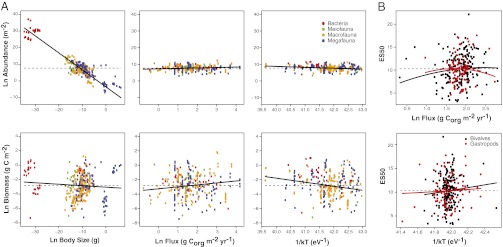
With frigid temperatures and virtually no in situ productivity, the deep oceans, Earth's largest ecosystem, are especially energy-deprived systems. Our knowledge of the effects of this energy limitation on all levels of biological organization is very incomplete. Here, we use the Metabolic Theory of Ecology to examine the relative roles of carbon flux and temperature in influencing metabolic rate, growth rate, lifespan, body size, abundance, biomass, and biodiversity for life on the deep seafloor. We show that the relative impacts of thermal and chemical energy change across organizational scales. Results suggest that individual metabolic rates, growth, and turnover proceed as quickly as temperature-influenced biochemical kinetics allow but that chemical energy limits higher-order community structure and function. Understanding deep-sea energetics is a pressing problem because of accelerating climate change and the general lack of environmental regulatory policy for the deep oceans.


Conflict of interest statement

The authors declare no conflict of interest.

Figures

Fig. 1.
Fig. 1.
Sampling locations of bacteria, meiofauna, macrofauna, and megafauna used in the standing stock (yellow triangles) and mollusks used in the diversity analyses (orange circles). Areas shallower than 200 m (i.e., continental shelf) are indicated by pale blue.
Fig. 2.
Fig. 2.
Body size and temperature scaling relationships for (A and B) mass-specific metabolic rate (W/g), (C and D) inverse lifespan (1/d), and (E and F) mass-specific growth rate (1/d). Data were obtained from diverse shallow and deep-sea organisms (data sources are given in Methods). Mass is expressed in grams, and temperature is expressed as 1/kT − 1/kTc (1/eV), where T is absolute temperature (in Kelvin) and Tc = 288 K (= 15 °C); therefore, the absolute values of the slopes of the temperature relationships correspond to the estimated activation energy, and the intercepts correspond to the logarithm of the rate for a 1 g organism at 15 °C. The models were fitted using common slopes in instances where ANOVA indicated that the estimated size exponent and/or estimated activation energy did not differ significantly among groups (P > 0.05). No line is depicted in D for deep-sea invertebrates, because temperature was insignificant (P = 0.78).
Fig. 3.
Fig. 3.
(A) Partial regression plots of body size, carbon flux, and temperature scaling of abundance and biomass in benthic deep-sea bacteria, meiofauna, macrofauna, and megafauna. Partial regression plots are provided instead of raw data to visualize the independent contributions of each factor. Mean values of predictor and response variables were added to residual values for the x and y axes, respectively. Solid lines denote fitted regressions, with slope equal to the parameter estimate in the spatial eigenvector model. Dashed lines indicate response variable mean. Corg = organic carbon. (B) Partial regression plots of carbon flux and temperature scaling of diversity (measured as the expected number of species at 50 individuals) for benthic deep-sea gastropods and bivalves of the Atlantic Ocean. Partial regression plots are provided instead of raw data to visualize the independent contributions of each factor. Mean values of predictor and response variables were added to residual values for the x and y axes, respectively. Solid lines denote fitted regressions, with slope equal to the parameter estimate in the spatial eigenvector model. Dashed lines indicate response variable mean. Full results for the models can be found in Tables 1 and 2.

References

    1. Clarke A, Gaston KJ. Climate, energy and diversity. Proc Biol Sci. 2006;273:2257–2266. - PMC - PubMed
    1. Nevo E. Evolution of genome-phenome diversity under environmental stress. Proc Natl Acad Sci USA. 2001;98:6233–6240. - PMC - PubMed
    1. Lane N, Martin W. The energetics of genome complexity. Nature. 2010;467:929–934. - PubMed
    1. Brown JH, Gillooly JF, Allen AP, Savage VM, West GB. Toward a metabolic theory of ecology. Ecology. 2004;85:1771–1789.
    1. Freckleton RP, Harvey PH, Pagel M. Bergmann’s rule and body size in mammals. Am Nat. 2003;161:821–825. - PubMed

Publication types

LinkOut - more resources