. 2012 Sep 25;109(39):15553-9.
doi: 10.1073/pnas.1213423109. Epub 2012 Sep 4.

Epistasis dominates the genetic architecture of Drosophila quantitative traits

Affiliations

Epistasis dominates the genetic architecture of Drosophila quantitative traits

Wen Huang et al. Proc Natl Acad Sci U S A. .

Abstract

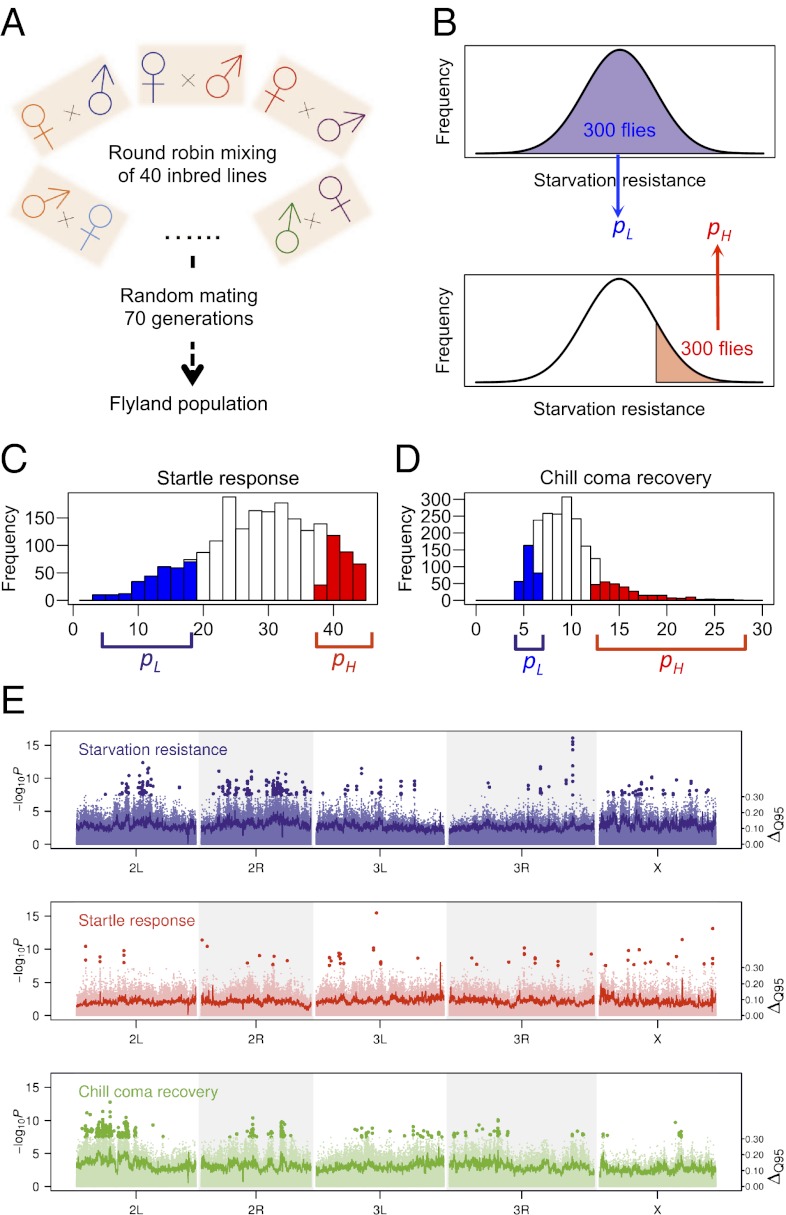
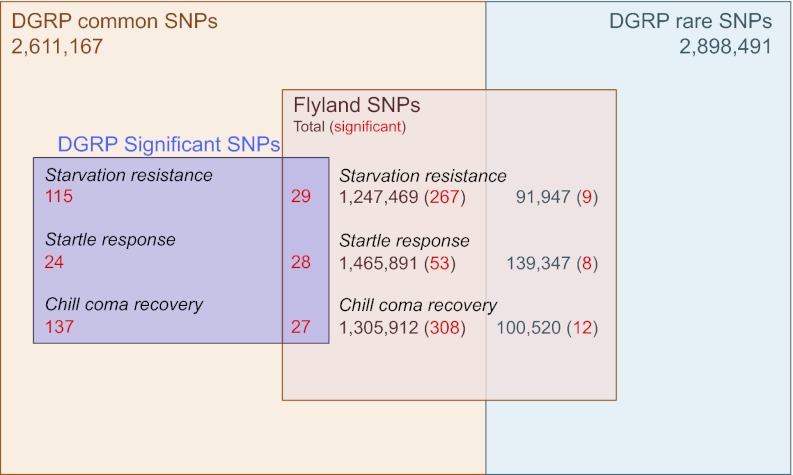
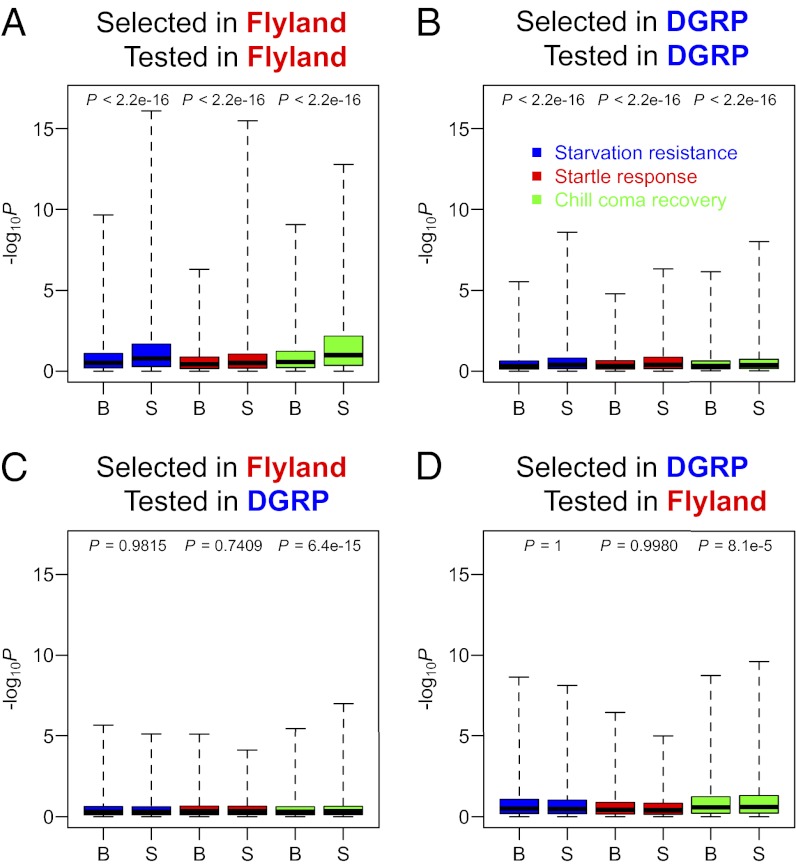
Epistasis-nonlinear genetic interactions between polymorphic loci-is the genetic basis of canalization and speciation, and epistatic interactions can be used to infer genetic networks affecting quantitative traits. However, the role that epistasis plays in the genetic architecture of quantitative traits is controversial. Here, we compared the genetic architecture of three Drosophila life history traits in the sequenced inbred lines of the Drosophila melanogaster Genetic Reference Panel (DGRP) and a large outbred, advanced intercross population derived from 40 DGRP lines (Flyland). We assessed allele frequency changes between pools of individuals at the extremes of the distribution for each trait in the Flyland population by deep DNA sequencing. The genetic architecture of all traits was highly polygenic in both analyses. Surprisingly, none of the SNPs associated with the traits in Flyland replicated in the DGRP and vice versa. However, the majority of these SNPs participated in at least one epistatic interaction in the DGRP. Despite apparent additive effects at largely distinct loci in the two populations, the epistatic interactions perturbed common, biologically plausible, and highly connected genetic networks. Our analysis underscores the importance of epistasis as a principal factor that determines variation for quantitative traits and provides a means to uncover genetic networks affecting these traits. Knowledge of epistatic networks will contribute to our understanding of the genetic basis of evolutionarily and clinically important traits and enhance predictive ability at an individualized level in medicine and agriculture.


Conflict of interest statement

The authors declare no conflict of interest.

Figures

Fig. 1.
Fig. 1.
Extreme QTL mapping in Flyland. (A) The Flyland population was generated by a round robin crossing design. Progeny of these crosses was mixed and outcrossed randomly for 70 generations. The last generation constituted the Flyland population. (B) For starvation resistance, a random sample of 300 and the 300 longest-living female flies constituted the sequenced pools. (C) Distribution of startle response for 2,000 phenotyped female flies in Flyland. (D) Distribution of chill coma recovery for 2,000 female flies in Flyland. The top (red) and bottom (blue) 15% scoring flies were pooled and sequenced. Allele frequencies were estimated in the high and low pools and compared to identify QTLs. (E) Plots of significance (−log10P; left axis) and allele frequency differences (ΔQ95; right axis) for extreme QTL mapping. Points of dark color indicate significant SNPs. The dark-colored lines connect consecutive sliding windows of 50 kb, with a step size of 5 kb. In each window, the 95% quantile of the absolute allele frequency difference is plotted.
Fig. 2.
Fig. 2.
No overlap between significant SNPs in Flyland and the DGRP. Numbers of SNPs overlapping between different categories of SNPs are shown in boxes. Numbers within each box are for SNPs in the corresponding category. SNPs belonging to multiple categories are indicated by overlaps between boxes.
Fig. 3.
Fig. 3.
Significance of SNPs around association signals selected in Flyland and the DGRP. (A) SNPs within 10 kb of significant Flyland SNPs were tested for associations with each trait in Flyland. The same number of background SNPs (B) was randomly drawn from the genome and tested for associations with the traits. P values are from Wilcoxon tests of the difference between the level of significance in selected (S) and background (B) sets. Similar analyses were also performed for (B) SNPs selected around DGRP signals and tested in the DGRP, (C) SNPs selected around Flyland signals and tested in the DGRP, and (D) SNPs selected around DGRP signals and tested in Flyland.
Fig. 4.
Fig. 4.
Context-dependent additive effects. A significant epistatic interaction is shown between two SNPs, A and B, each with two alleles (indicated by subscripts 1 and 2). There is no difference in the effect of the two alleles of SNP A in the B1 genetic background but a large difference in the B2 background. The sizes of the symbols are proportional to the genotype frequency. (A) SNP A has a large main effect (shown by the regression line) when the A2B2 genotype has a high frequency. (B) The main effect of SNP A is diminished when the A2B1 genotype has a high frequency.
Fig. 5.
Fig. 5.
Networks of epistatic interactions. Interaction networks are depicted for (A) starvation resistance and (B) chill coma recovery. Nodes depict genes, and edges significant interactions. Red nodes are genes containing significant SNPs from the Flyland analysis. Blue nodes are genes containing significant SNPs from DGRP analysis.

References

    1. Hindorff LA, et al. A Catalog of Published Genome-Wide Association Studies. Available at www.genome.gov/gwastudies. Accessed May 8, 2012.
    1. Flint J, Mackay TF. Genetic architecture of quantitative traits in mice, flies, and humans. Genome Res. 2009;19:723–733. - PMC - PubMed
    1. Manolio TA, et al. Finding the missing heritability of complex diseases. Nature. 2009;461:747–753. - PMC - PubMed
    1. Yang J, et al. Common SNPs explain a large proportion of the heritability for human height. Nat Genet. 2010;42:565–569. - PMC - PubMed
    1. Falconer DS, Mackay TFC. Introduction to Quantitative Genetics. 4th Ed. Essex, England: Addison Wesley Longman; 1996.

Publication types

MeSH terms

LinkOut - more resources