. 2012 Sep 18;109(38):15259-64.
doi: 10.1073/pnas.1205508109. Epub 2012 Sep 4.

Oncogenic mutations mimic and enhance dynamic events in the natural activation of phosphoinositide 3-kinase p110α (PIK3CA)

Affiliations

Oncogenic mutations mimic and enhance dynamic events in the natural activation of phosphoinositide 3-kinase p110α (PIK3CA)

John E Burke et al. Proc Natl Acad Sci U S A. .

Abstract

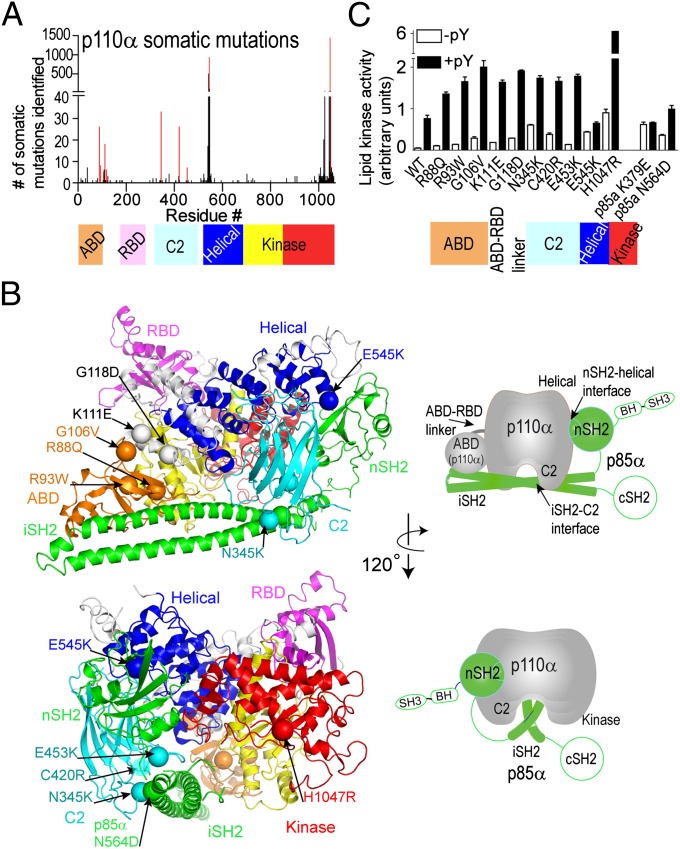
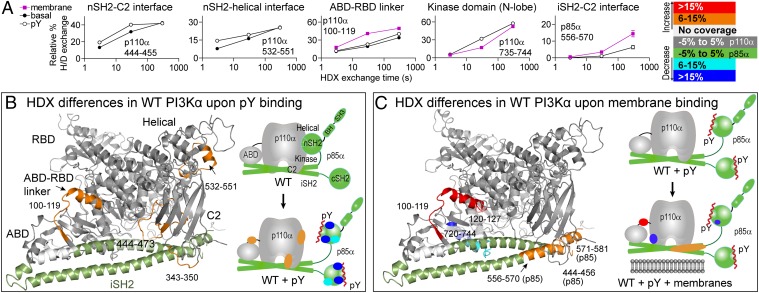
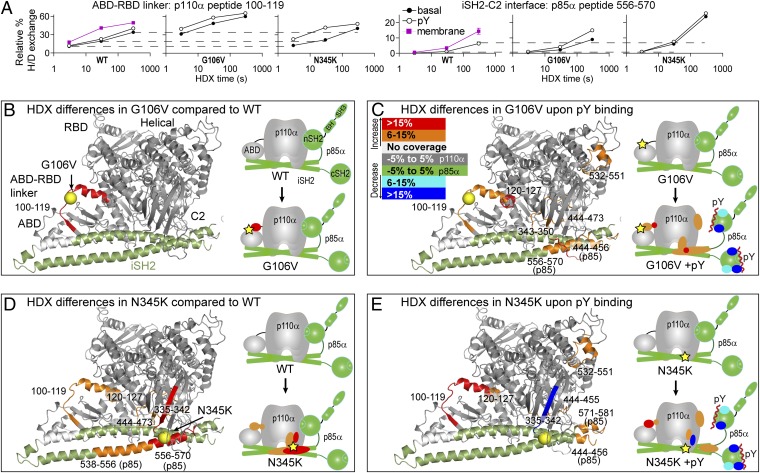
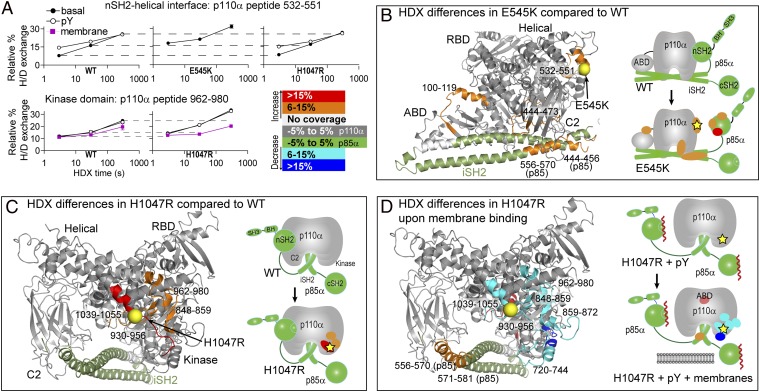
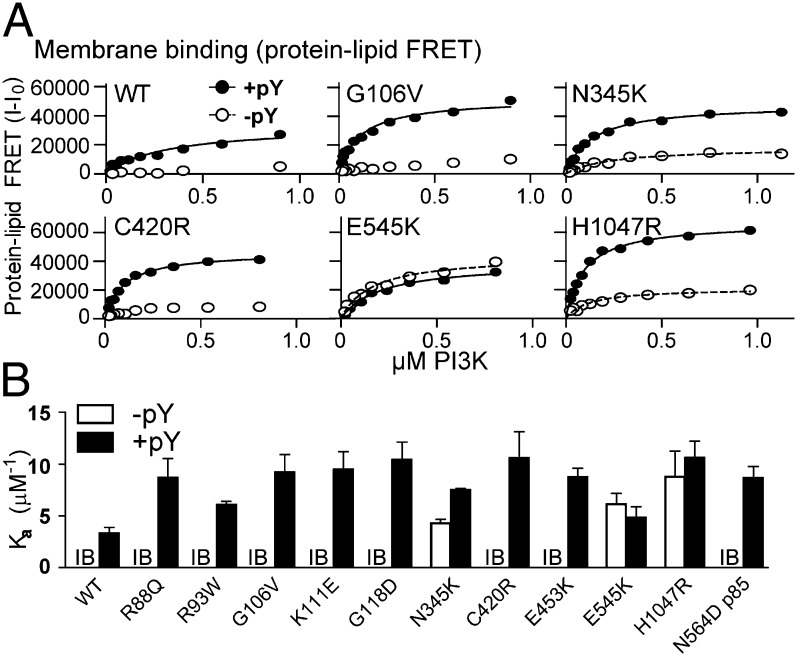
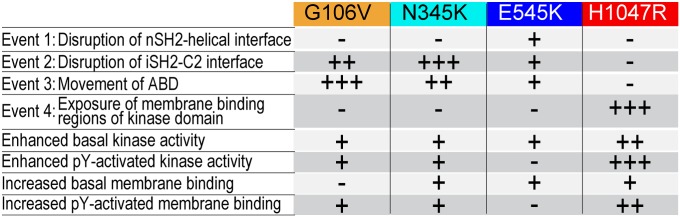
The p110α catalytic subunit (PIK3CA) is one of the most frequently mutated genes in cancer. We have examined the activation of the wild-type p110α/p85α and a spectrum of oncogenic mutants using hydrogen/deuterium exchange mass spectrometry (HDX-MS). We find that for the wild-type enzyme, the natural transition from an inactive cytosolic conformation to an activated form on membranes entails four distinct events. Analysis of oncogenic mutations shows that all up-regulate the enzyme by enhancing one or more of these dynamic events. We provide the first insight into the activation mechanism by mutations in the linker between the adapter-binding domain (ABD) and the Ras-binding domain (RBD) (G106V and G118D). These mutations, which are common in endometrial cancers, enhance two of the natural activation events: movement of the ABD and ABD-RBD linker relative to the rest of the catalytic subunit and breaking the C2-iSH2 interface on binding membranes. C2 domain mutants (N345K and C420R) also mimic these events, even in the absence of membranes. A third event is breaking the nSH2-helical domain contact caused by phosphotyrosine-containing peptides binding to the enzyme, which is mimicked by a helical domain mutation (E545K). Interaction of the C lobe of the kinase domain with membranes is the fourth activation event, and is potentiated by kinase domain mutations (e.g., H1047R). All mutations increased lipid binding and basal activity, even mutants distant from the membrane surface. Our results elucidate a unifying mechanism in which diverse PIK3CA mutations stimulate lipid kinase activity by facilitating allosteric motions required for catalysis on membranes.


Conflict of interest statement

The authors declare no conflict of interest.

Figures

Fig. 1.
Fig. 1.
Distribution and activity of cancer-associated p110α/p85α mutants. (A) Frequency of somatic mutations in p110α versus residue number, with domains of p110α colored. Bars for mutations analyzed in this study are highlighted in red. (B) Locations of cancer-linked mutants analyzed in this study are shown as spheres mapped on the crystal structure of p110α/niSH2-p85α (Protein DataBank, pdb: 3HHM). Schematics of the crystal structure with catalytic subunit in gray and p85 in green simplify the views presented. The p85 domains missing from the crystal structure are outlined in green. (C) Lipid kinase assays of somatic mutants. Assays measured 32P-PIP3 production. Assays were performed in duplicate and repeated twice.
Fig. 2.
Fig. 2.
Changes in HDX in full-length WT p110α/p85α in the presence of pY and PIP2 vesicles. (A) Time course of HDX incorporation for representative peptides that showed differences in HDX upon addition of pY, ±lipid vesicles. (B) Peptides in p110α and the iSH2 of p85α that showed differences in HDX both greater than 0.5 Da and 6% between the basal and pY-activated WT or (C) between the pY-activated WT with and without membranes, are highlighted on both the structure of p110α/iSH2-p85α (pdb: 3HHM) and on a schematic. Peptides with no differences are shown in gray for p110α and green for p85α. All further HDX figures use this same mapping scheme. The full set of HDX incorporation plots for peptides with differences in HDX are shown in Fig. S8, and differential HDX-MS data are in Figs. S5 and S6.
Fig. 3.
Fig. 3.
Changes in HDX levels in the G106V and N345K cancer mutants either basally or upon pY activation. HDX differences caused by membrane binding for these mutants are in Fig. S4. (A) HDX curves for representative peptides with differences in HDX upon mutation or pY activation. Dotted lines across plots indicate the deuteration levels of the basal WT state. A more complete set of HDX curves is shown in Fig. S9, and the HDX differential data are in Figs. S5 and S6. (B) Peptides with differences in HDX between the WT and the G106V mutant, (C) upon pY binding of the G106V mutant, (D) between the WT and the N345K mutant, and (E) upon pY binding of the N345K mutant are highlighted on the structure of p110α/iSH2-p85α and on a schematic. Locations of cancer mutations are indicated with yellow spheres on the crystal structure and yellow stars on the schematic.
Fig. 4.
Fig. 4.
Changes in HDX levels in the E545K and H1047R cancer mutants either basally or upon membrane binding. HDX differences caused by pY binding for these mutants are in Fig. S4. (A) HDX curves for representative peptides with differences in HDX upon mutation, pY activation, or membrane binding. HDX rates for the 532–551 peptide from WT and H1047R are similar, whereas the E545K mutant differs. A more complete set is shown in Fig. S9, and the HDX differential data are in Figs. S5 and S6. (B) Peptides with differences in HDX between the WT and the E545K mutant, (C) between the WT and the H1047R mutant, and (D) upon membrane binding of the H1047R mutant are highlighted on the structure of p110α/iSH2-p85α and on a schematic.
Fig. 5.
Fig. 5.
Lipid binding of cancer mutants. (A) Protein–lipid FRET binding curves for a selection of mutants ±5 μM pY. Full lipid-binding curves used to calculate Ka values are in Fig. S7. (B) Protein–lipid FRET assays were performed with 5% PIP2 vesicles, and Ka was calculated for both ±5 μM pY. All experiments were performed in triplicate. In the absence of pY, the majority of proteins had FRET levels that were too low for reliable curve fitting and are indicated by IB (insufficient binding), and no Ka value is reported.
Fig. 6.
Fig. 6.
Conformational changes in the catalytic cycle of p110α/p85α. Summary of the effects of selected cancer mutants on conformational events, lipid kinase activity, and lipid binding.

References

    1. Chang HW, et al. Transformation of chicken cells by the gene encoding the catalytic subunit of PI 3-kinase. Science. 1997;276:1848–1850. - PubMed
    1. Samuels Y, et al. High frequency of mutations of the PIK3CA gene in human cancers. Science. 2004;304:554. - PubMed
    1. Chalhoub N, Baker SJ. PTEN and the PI3-kinase pathway in cancer. Annu Rev Pathol. 2009;4:127–150. - PMC - PubMed
    1. Vadas O, Burke JE, Zhang X, Berndt A, Williams RL. Structural basis for activation and inhibition of class I phosphoinositide 3-kinases. Sci Signal. 2011;4:re2. - PubMed
    1. Hon WC, Berndt A, Williams RL. Regulation of lipid binding underlies the activation mechanism of class IA PI3-kinases. Oncogene. 2012;31:3655–3666. - PMC - PubMed

Publication types

MeSH terms

Substances

LinkOut - more resources