. 2012 Jun 13;13(9):R53.
doi: 10.1186/gb-2012-13-9-r53.

Modeling gene expression using chromatin features in various cellular contexts

Affiliations

Modeling gene expression using chromatin features in various cellular contexts

Xianjun Dong et al. Genome Biol. .

Abstract

Background: Previous work has demonstrated that chromatin feature levels correlate with gene expression. The ENCODE project enables us to further explore this relationship using an unprecedented volume of data. Expression levels from more than 100,000 promoters were measured using a variety of high-throughput techniques applied to RNA extracted by different protocols from different cellular compartments of several human cell lines. ENCODE also generated the genome-wide mapping of eleven histone marks, one histone variant, and DNase I hypersensitivity sites in seven cell lines.

Results: We built a novel quantitative model to study the relationship between chromatin features and expression levels. Our study not only confirms that the general relationships found in previous studies hold across various cell lines, but also makes new suggestions about the relationship between chromatin features and gene expression levels. We found that expression status and expression levels can be predicted by different groups of chromatin features, both with high accuracy. We also found that expression levels measured by CAGE are better predicted than by RNA-PET or RNA-Seq, and different categories of chromatin features are the most predictive of expression for different RNA measurement methods. Additionally, PolyA+ RNA is overall more predictable than PolyA- RNA among different cell compartments, and PolyA+ cytosolic RNA measured with RNA-Seq is more predictable than PolyA+ nuclear RNA, while the opposite is true for PolyA- RNA.

Conclusions: Our study provides new insights into transcriptional regulation by analyzing chromatin features in different cellular contexts.


Figures

Figure 1
Figure 1
Modeling pipeline. Genes longer than 4,100 bp were extended and divided into 81 bins. The chromatin feature density in each bin is logarithm-transformed and then used to determine the best bin (the bin that has the strongest correlation with the expression values). To avoid log2(0), a pseudocount is added to each bin, which is then optimized using one-third of genes in each dataset (D1) and then applied to the other two-thirds of genes in the datasets (D2) for the rest of the analysis. D2 was divided into training set (TR) and testing set (TS) in a ten-fold cross-validation manner. A two-step model was built using the training set. First, a classification model C(X) was learned to discriminate the 'on' and 'off' genes, followed by a regression model R(X) for predicting the expression levels of the 'on' genes. Finally, the correlation between the predicted expression values for testing set, C(TS_X)*R(TS_X), and the measured expression values of testing set (TS_Y) was used to measure the overall performance of the model. TSS, transcription start site; TTS, transcription termination site; RMSE, root-mean-square error.
Figure 2
Figure 2
Quantitative relationship between chromatin feature and expression. (a) Scatter plot of predicted expression values using the two-step prediction model (random forests classification model and linear regression model) versus the measured PolyA+ cytosolic RNA from K562 cells measured by CAGE. Each blue dot represents one gene. The red dashed line indicates the linear fit between measured and predicted expression values, which are highly correlated (PCC r = 0.9, P-value <2.2 × 10⁻¹⁶), indicating a quantitative relationship between chromatin features and expression levels. The accuracy for the overall model is indicated by RMSE (root-mean-square error), which is 1.9. Accuracy for the classification model is indicated by AUC (area under the ROC curve), which is 0.95. The accuracy for the regression model is r = 0.77 (RMSE = 2.3). (b) The relative importance of chromatin features in the two-step model. The most important features for the classifier (upper panel) include H3K9ac, H3K4me3, and DNase I hypersensitivity, while the most important features for the regressor (bottom panel) include H3K79me2, H3K36me3, and DNase I hypersensitivity. (c) Summary of overall prediction accuracy on 78 expression experiments on whole cell, cytosolic or nuclear RNA from seven cell lines. The bars are sorted by correlation coefficient in decreasing order for each high throughput technique (CAGE, RNA-PET and RNA-Seq). Each bar is composed of several colors, corresponding to the relative contribution of each feature in the regression model. The red dashed line represents median PCC r = 0.83. Code for cell lines: K, K562; G, GM12878; 1, H1-hESC; H, HepG2; E, HeLa-S3; N, NHEK; U, HUVEC. Code for RNA extraction: +, PolyA+; -, PolyA-. Code for cell compartment: W, whole cell; C, cytosol; N, nucleus.
Figure 3
Figure 3
Comparison of expression quantification methods. (a) Heatmap of correlations between PolyA+ experiments from various cell lines and cell compartments. Experiments from the same expression quantification methods tend to cluster together, and CAGE and RNA-PET are closer to each other than they are to RNA-Seq. The clustering tree also shows that experiments on different cell compartments in the same cell line tend to group together and RNA expression from the cytosol (blue) and whole cell (black) tend to group together rather than with that of the nucleus (light blue). Code for cell lines: K, K562; G, GM12878; 1, H1-hESC; H, HepG2; E, HeLa-S3; N, NHEK; U, HUVEC. (b) Boxplot of correlation coefficients for all expression prediction in CAGE, RNA-PET, and RNA-Seq categories. Paired Wilcoxon test shows that CAGE-based expression data are significantly better predicted than RNA-Seq-based expression data (P-value = 3 × 10⁻⁵).
Figure 4
Figure 4
Comparison of prediction accuracy across different cell lines. (a) Boxplot of correlation coefficients for seven cell lines (K562, GM12878, H1-hESC, HeLa-S3, HepG2, HUVEC and NHEK) with different types of expression quantification (CAGE, RNA-PET, and RNA-Seq). It shows that the high quantitative relationship between chromatin features and expression exist in various cell lines and using different expression quantification methods. Paired Wilcoxon tests between H1-hESC and other cell lines show that H1-hESC has significantly lower prediction accuracy (P-value = 0.02, 0.02, 0.07, 0.02, and 0.05 for K562, GM12878, HeLa-S3, HepG2 and HUVEC, respectively). (b) Application of the model learned from K562 to other cell lines (GM12878, H1-hESC, HeLa-S3 and NHEK) indicates that the model performs well across cell lines (r = 0.82, 0.86, 0.87 and 0.84, respectively). This indicates that the quantitative relationship between chromatin features and gene expression is not cell line-specific, but rather a general feature.
Figure 5
Figure 5
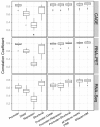
Comparison of groups of chromatin features. Twelve chromatin features are grouped into four categories according to their known function in gene regulation: promoter marks (H3K4me2, H3K4me3, H2A.Z, H3K9ac, and H3K27ac), structural marks (H3K36me3 and H3K79me2), repressor marks (H3K27me3 and H3K9me3), and distal/other marks (H3K4me1, H4K20me1, and H3K9me1). Correlation coefficients are shown for individual categories, a combination of promoter with three other categories, all histone marks (HM), and HM together with DNase I hypersensitivity are shown in the boxplot for CAGE (TSS-based), RNA-PET (TSS-based), and RNA-Seq (Tx-based) expression data. It indicates that for TSS-based data, promoter marks are the most predictive among the four categories, while for Tx-based expression, structural marks are the most predictive.
Figure 6
Figure 6
Comparison of the prediction accuracy of high- and low-CpG content promoter gene categories. (a) Summary of prediction accuracy for all high-CpG content promoter (HCP) genes in 78 RNA expression experiments on whole cell, cytosolic or nuclear RNA, showing that the median correlation for all experiments is r = 0.8. Each bar is divided into different colors corresponding to the relative contribution of variables in the regression model. (b) Same as in (a), but for low-CpG content promoter (LCP) genes, showing that the median correlation coefficient for all experiments is r = 0.66. This indicates that HCP genes are better predicted than LCP genes. Comparison of the relative contribution of various chromatin features in each experiment indicates that the promoter marks (red and light red) show more importance in predicting LCP genes using TSS-based data (for example, CAGE and RNA-PET), while structural marks (green show most importance in predicting LCP genes for transcript-based data. Code for cell lines: K, K562; G, GM12878; 1, H1-hESC; H, HepG2; E, HeLa-S3; N, NHEK; U, HUVEC. Code for RNA extraction: +, PolyA+; -, PolyA-. Code for cell compartment: W, whole cell; C, cytosol; N, nucleus.
Figure 7
Figure 7
Comparison of prediction accuracy among different RNA extractions and different cell compartments. (a) Prediction accuracy of PolyA+ and PolyA- RNA for all genes measured with the CAGE and RNA-Seq techniques. This shows that PolyA+ RNA are better predicted than PolyA- RNA (P-value of paired Wilcoxon test between PolyA+ and PolyA-). (b) Prediction accuracy of PolyA+ and PolyA- RNA from different cell compartments for all genes measured with the RNA-Seq technique (P-value of paired Wilcoxon test between cytosol and nuclues). (c) Prediction accuracy of total RNA in different nuclear sub-compartments, measured by CAGE or RNA-Seq.

References

    1. Kouzarides T. Chromatin modifications and their function. Cell. 2007;128:693–705. doi: 10.1016/j.cell.2007.02.005. - DOI - PubMed
    1. Strahl BD, Allis CD. The language of covalent histone modifications. Nature. 2000;403:41–45. doi: 10.1038/47412. - DOI - PubMed
    1. Jenuwein T, Allis CD. Translating the histone code. Science. 2001;293:1074–1080. doi: 10.1126/science.1063127. - DOI - PubMed
    1. Benevolenskaya EV. Histone H3K4 demethylases are essential in development and differentiation. Biochem Cell Biol. 2007;85:435–443. doi: 10.1139/O07-057. - DOI - PubMed
    1. Koch CM, Andrews RM, Flicek P, Dillon SC, Karaöz U, Clelland GK, Wilcox S, Beare DM, Fowler JC, Couttet P, James KD, Lefebvre GC, Bruce AW, Dovey OM, Ellis PD, Dhami P, Langford CF, Weng Z, Birney E, Carter NP, Vetrie D, Dunham I. The landscape of histone modifications across 1% of the human genome in five human cell lines. Genome Res. 2007;17:691–707. doi: 10.1101/gr.5704207. - DOI - PMC - PubMed

Publication types

LinkOut - more resources