

Phylogenetic relationships among Staphylococcus species and refinement of cluster groups based on multilocus data
- PMID: 22950675
- PMCID: PMC3464590
- DOI: 10.1186/1471-2148-12-171
Phylogenetic relationships among Staphylococcus species and refinement of cluster groups based on multilocus data
Abstract
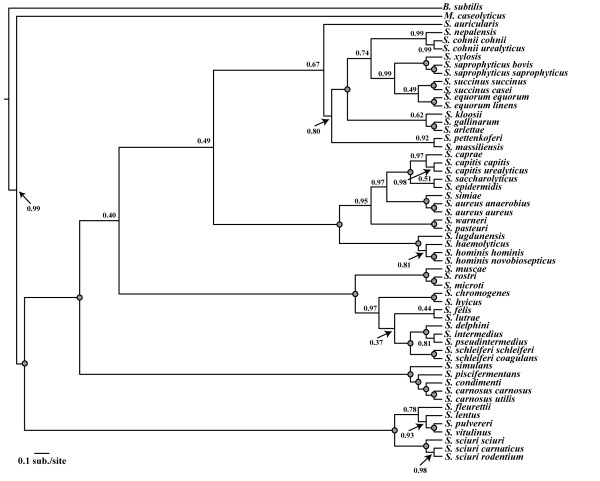
Background: Estimates of relationships among Staphylococcus species have been hampered by poor and inconsistent resolution of phylogenies based largely on single gene analyses incorporating only a limited taxon sample. As such, the evolutionary relationships and hierarchical classification schemes among species have not been confidently established. Here, we address these points through analyses of DNA sequence data from multiple loci (16S rRNA gene, dnaJ, rpoB, and tuf gene fragments) using multiple Bayesian and maximum likelihood phylogenetic approaches that incorporate nearly all recognized Staphylococcus taxa.
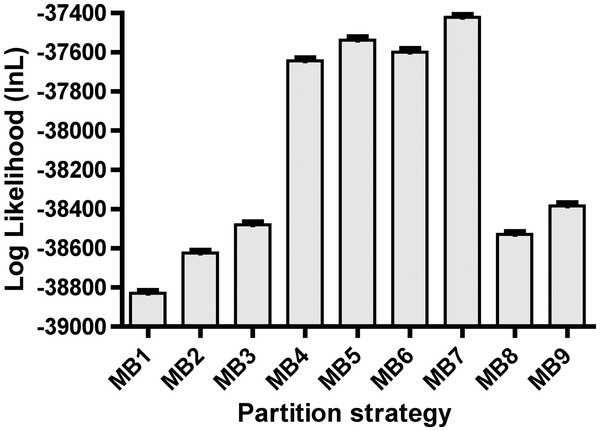
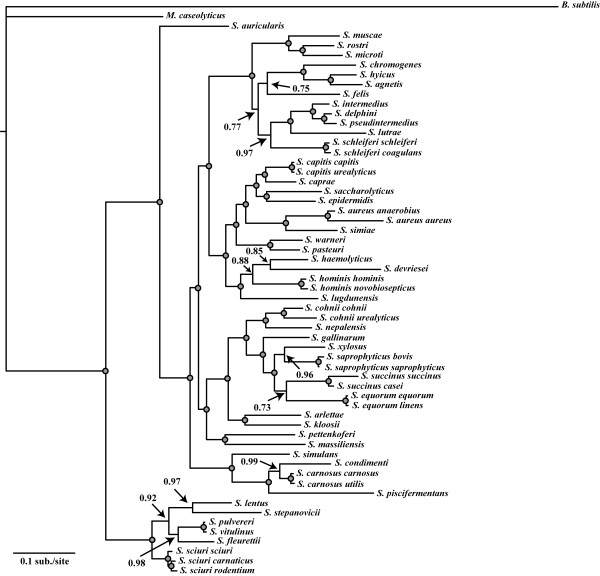
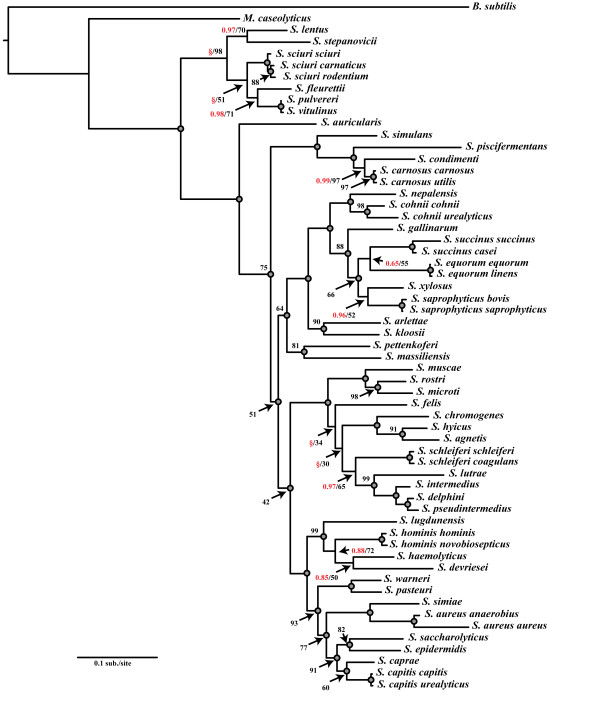
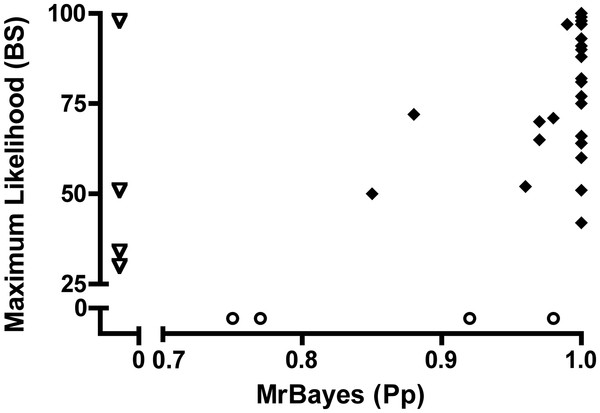
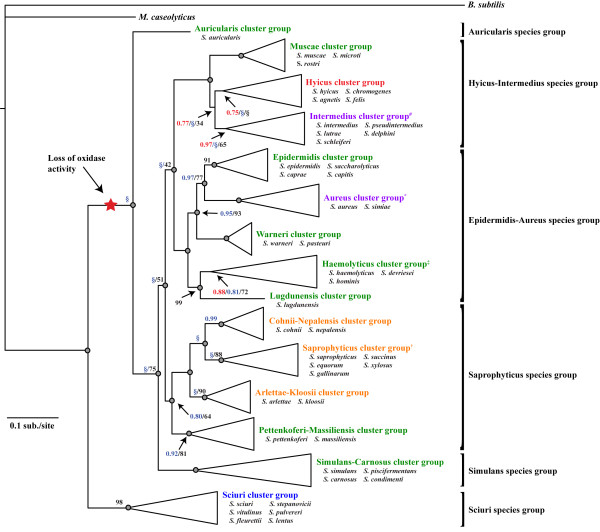
Results: We estimated the phylogeny of fifty-seven Staphylococcus taxa using partitioned-model Bayesian and maximum likelihood analysis, as well as Bayesian gene-tree species-tree methods. Regardless of methodology, we found broad agreement among methods that the current cluster groups require revision, although there was some disagreement among methods in resolution of higher order relationships. Based on our phylogenetic estimates, we propose a refined classification for Staphylococcus with species being classified into 15 cluster groups (based on molecular data) that adhere to six species groups (based on phenotypic properties).
Conclusions: Our findings are in general agreement with gene tree-based reports of the staphylococcal phylogeny, although we identify multiple previously unreported relationships among species. Our results support the general importance of such multilocus assessments as a standard in microbial studies to more robustly infer relationships among recognized and newly discovered lineages.
Figures
Similar articles
-
Phylogenetic relationships of 38 taxa of the genus Staphylococcus based on 16S rRNA gene sequence analysis.Int J Syst Bacteriol. 1999 Apr;49 Pt 2:725-8. doi: 10.1099/00207713-49-2-725. Int J Syst Bacteriol. 1999. PMID: 10319495
-
Genetic diversity of Staphylococcus equorum isolates from Saeu-jeotgal evaluated by multilocus sequence typing.Antonie Van Leeuwenhoek. 2014 Oct;106(4):795-808. doi: 10.1007/s10482-014-0249-6. Epub 2014 Aug 8. Antonie Van Leeuwenhoek. 2014. PMID: 25103946
-
Multilocus phylogeny of the lichen-forming fungal genus Melanohalea (Parmeliaceae, Ascomycota): insights on diversity, distributions, and a comparison of species tree and concatenated topologies.Mol Phylogenet Evol. 2013 Jan;66(1):138-52. doi: 10.1016/j.ympev.2012.09.013. Epub 2012 Sep 24. Mol Phylogenet Evol. 2013. PMID: 23017822
-
dnaJ gene sequence-based assay for species identification and phylogenetic grouping in the genus Staphylococcus.Int J Syst Evol Microbiol. 2007 Jan;57(Pt 1):25-30. doi: 10.1099/ijs.0.64205-0. Int J Syst Evol Microbiol. 2007. PMID: 17220435
-
Multilocus sequence analysis (MLSA) in prokaryotic taxonomy.Syst Appl Microbiol. 2015 Jun;38(4):237-45. doi: 10.1016/j.syapm.2015.03.007. Epub 2015 Apr 11. Syst Appl Microbiol. 2015. PMID: 25959541 Review.
Cited by
-
Comparative genomics of Staphylococcus capitis reveals species determinants.Front Microbiol. 2022 Sep 30;13:1005949. doi: 10.3389/fmicb.2022.1005949. eCollection 2022. Front Microbiol. 2022. PMID: 36246238 Free PMC article.
-
Staphylococcus xylosus and Staphylococcus aureus as commensals and pathogens on murine skin.Lab Anim Res. 2023 Aug 2;39(1):18. doi: 10.1186/s42826-023-00169-0. Lab Anim Res. 2023. PMID: 37533118 Free PMC article. Review.
-
Safety Evaluation of the Coagulase-Negative Staphylococci Microbiota of Salami: Superantigenic Toxin Production and Antimicrobial Resistance.Biomed Res Int. 2015;2015:483548. doi: 10.1155/2015/483548. Epub 2015 Nov 30. Biomed Res Int. 2015. PMID: 26697486 Free PMC article.
-
Multi-species host range of staphylococcal phages isolated from wastewater.Nat Commun. 2021 Nov 29;12(1):6965. doi: 10.1038/s41467-021-27037-6. Nat Commun. 2021. PMID: 34845206 Free PMC article.
-
Identification of Three Clf-Sdr Subfamily Proteins in Staphylococcus warneri, and Comparative Genomics Analysis of a Locus Encoding CWA Proteins in Staphylococcus Species.Front Microbiol. 2021 Jul 29;12:691087. doi: 10.3389/fmicb.2021.691087. eCollection 2021. Front Microbiol. 2021. PMID: 34394031 Free PMC article.
References
-
- Novakova D, Pantucek R, Hubalek Z, Falsen E, Busse HJ, Schumann P, Sedlacek I. Staphylococcus microti sp. nov., isolated from the common vole (Microtus arvalis) Int J Syst Evol Microbiol. 2010;60(Pt 3):566–573. - PubMed
-
- Hauschild T. Phenotypic and genotypic identification of staphylococci isolated from wild small mammals. Syst Appl Microbiol. 2001;24(3):411–416. - PubMed
-
- Gribaldo S, Cookson B, Saunders N, Marples R, Stanley J. Rapid identification by specific PCR of coagulase-negative staphylococcal species important in hospital infection. J Med Microbiol. 1997;46(1):45–53. - PubMed
Publication types
MeSH terms
Substances
Grants and funding
LinkOut - more resources
Full Text Sources
Research Materials
