. 2012 Sep 26;13(9):R48.
doi: 10.1186/gb-2012-13-9-r48.

Classification of human genomic regions based on experimentally determined binding sites of more than 100 transcription-related factors

Affiliations

Classification of human genomic regions based on experimentally determined binding sites of more than 100 transcription-related factors

Kevin Y Yip et al. Genome Biol. .

Abstract

Background: Transcription factors function by binding different classes of regulatory elements. The Encyclopedia of DNA Elements (ENCODE) project has recently produced binding data for more than 100 transcription factors from about 500 ChIP-seq experiments in multiple cell types. While this large amount of data creates a valuable resource, it is nonetheless overwhelmingly complex and simultaneously incomplete since it covers only a small fraction of all human transcription factors.

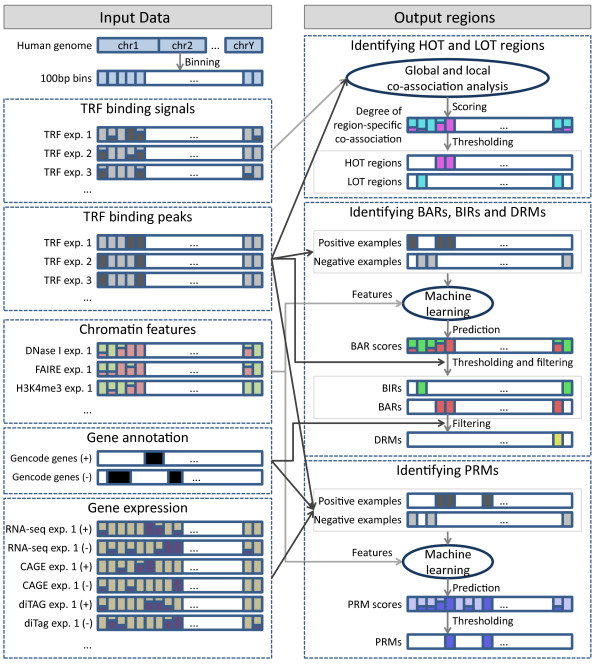
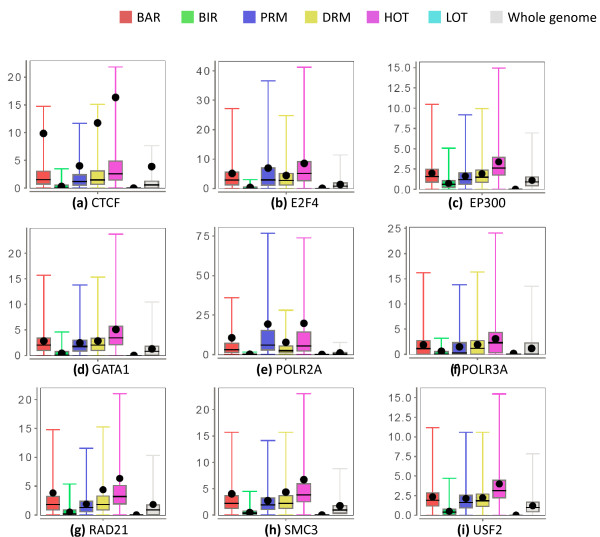
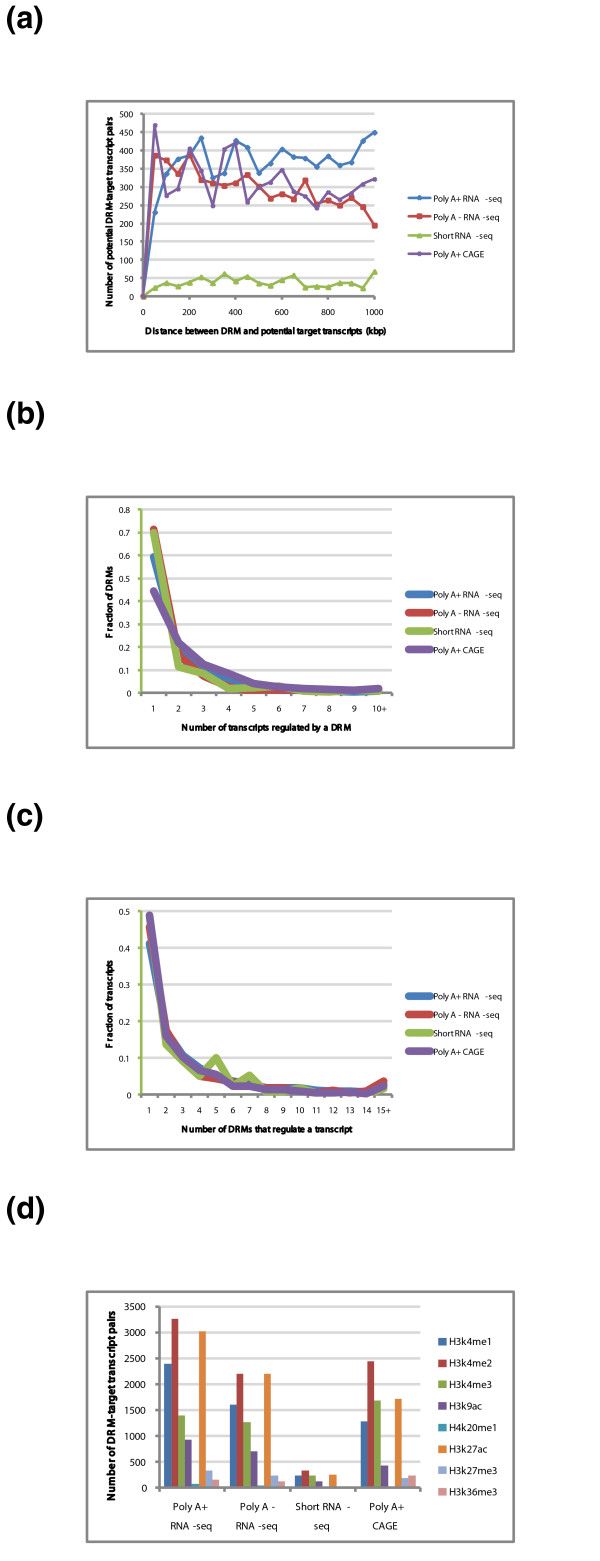
Results: As part of the consortium effort in providing a concise abstraction of the data for facilitating various types of downstream analyses, we constructed statistical models that capture the genomic features of three paired types of regions by machine-learning methods: firstly, regions with active or inactive binding; secondly, those with extremely high or low degrees of co-binding, termed HOT and LOT regions; and finally, regulatory modules proximal or distal to genes. From the distal regulatory modules, we developed computational pipelines to identify potential enhancers, many of which were validated experimentally. We further associated the predicted enhancers with potential target transcripts and the transcription factors involved. For HOT regions, we found a significant fraction of transcription factor binding without clear sequence motifs and showed that this observation could be related to strong DNA accessibility of these regions.

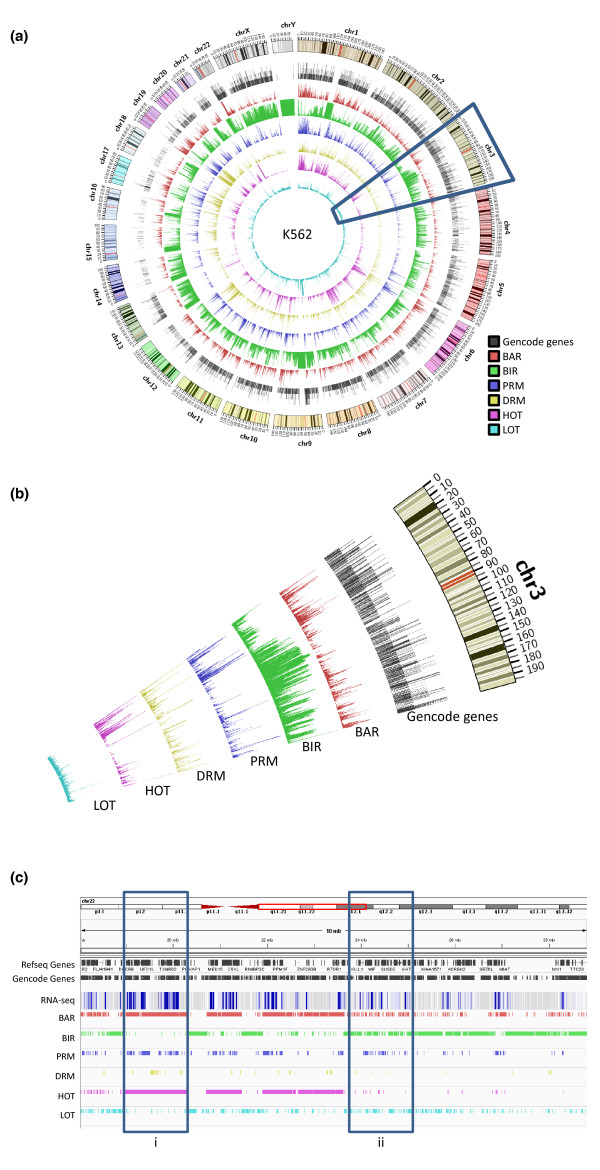
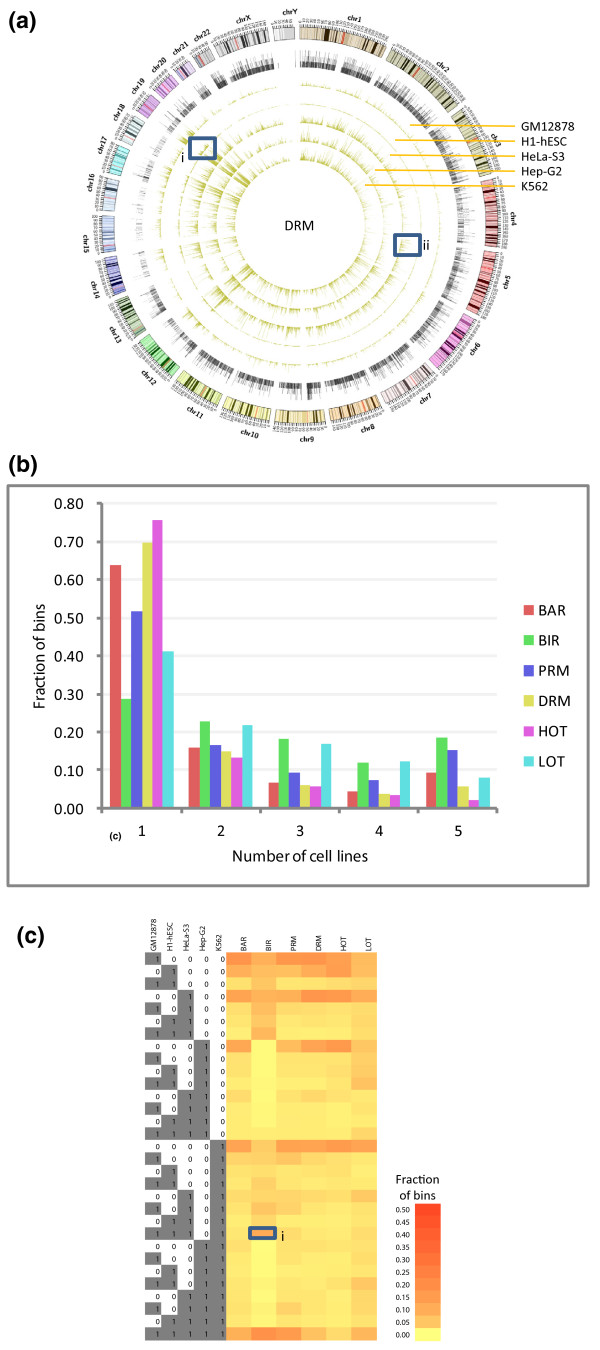
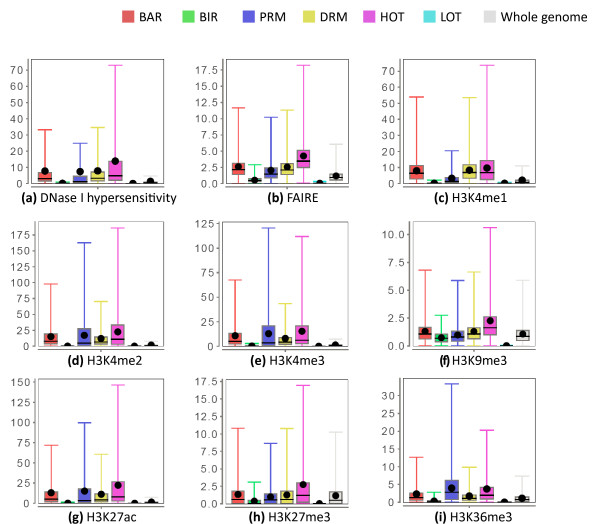
Conclusions: Overall, the three pairs of regions exhibit intricate differences in chromosomal locations, chromatin features, factors that bind them, and cell-type specificity. Our machine learning approach enables us to identify features potentially general to all transcription factors, including those not included in the data.


Figures

Figure 1
Figure 1
Overview of the pipeline for identifying the six types of regions for one cell line. The left side shows the input data involved. The right side shows how these datasets were used to identify the regions. The same pipeline was applied to five different cell lines. See Materials and methods for details. The color scheme for the six regions is used in all figures and supplementary figures of the paper. CAGE, cap-analysis of gene expression; exp., experiment.
Figure 2
Figure 2
Distribution of the six types of regions in the genome in K562. (a) Densities of the regions in the whole genome, defined as the running fractions of bases covered by the regions. The tracks are, respectively, from outermost to innermost, the ideogram for the human karyotype (genome build hg19), Gencode version 7 level 1 and level 2 genes, BARs, BIRs, PRMs, DRMs, HOT regions and LOT regions. The tracks are scaled separately to show density fluctuations. The highlighted segment corresponds to the area in (b). (b) Zoom-in of chromosome 3 to show the correlated fluctuations of the different types of regions. (c) Locations of the six types of regions at the beginning of the q-arm of chromosome 22 in K562. Due to the high density of genes, only a subset of the gene names is shown. Expression values were measured by long poly-A+ RNA-seq of whole-cell RNA extract. A darker color indicates a higher average expression level in the local region. Box i marks a broad area with significant active TF binding and co-binding. Box ii marks an area with many small interspersed active and inactive TF binding regions.
Figure 3
Figure 3
Distribution of the DRMs in the five different cell lines. (a) Densities of the regions in the whole genome, defined as the running fractions of bases covered by the regions. The tracks are, respectively, from the outermost to the innermost, the ideogram for the human karyotype (genome build hg19), Gencode version 7 level 1 and level 2 genes, and regions in GM12878, H1-hESC, HeLa-S3, Hep-G2 and K562. The five innermost tracks are all in the same scale. Box i shows an area with an exceptionally high density of DRMs on chromosome 19 in the h1-hESC line. Box ii shows an area with exceptionally high density of DRMs on chromosome 5 in HeLa-S3 cells. (b) Fraction of bins covered by the six types of regions shared by different numbers of cell lines. (c) Fraction of bins covered by the six types of regions shared by the 31 possible combinations of the 5 cell lines. Box i marks the high fraction of BIR bins shared by cell lines GM12878, H1-hESC, HeLa-S3, and K562.
Figure 4
Figure 4
Chromatin features of the six types of regions in K562. (a) DNase I hypersensitivity from the dataset Uw.OpenChrom.K562.Dnase.Na (compare Figure S8E in Additional file 2). (b) FAIRE signals from the dataset Unc.OpenChrom.K562.Faire.Na. (c) H3K4me1 signals from the dataset Broad.Histone.K562.H3K4me1.Std. (d) H3K4me2 signals from the dataset Broad.Histone.K562.H3K4me2.Std. (e) H3K4me3 signals from the dataset Broad.Histone.K562.H3K4me3.Std. (f) H3K9me3 signals from the dataset Broad.Histone.K562.H3k9me3.Std. (g) H3K27ac signals from the dataset Broad.Histone.K562.H3k27ac.Std. (h) H3K27me3 signals from the dataset Uw.Histone.K562.H3k27me3.Std. (i) H3K36me3 signals from the dataset Uw.Histone.K562.H3k36me3.Std. Each dataset ID has the format <Data source>.<Experiment type>.<Cell line>.<Open chromatin method/histone modification/TF>.<Experiment details>. The dot in each box-and-whisker plot is the average value. Some outlier values are not shown. See Materials and methods for details.
Figure 5
Figure 5
TRF binding signals of the six types of regions in K562. (a) CTCF signals from the dataset Uta.Tfbs.K562.Ctcf.Na. (b) E2F4 signals from the datasets Sydh.Tfbs.K562.E2f4.Ucd. (c) EP300 signals from the dataset Sydh.Tfbs.K562.P300f4.Iggrab. (d) GATA1 signals from the dataset Sydh.Tfbs.K562.Gata1.Ucd. (e) POLR2A signals from the dataset Sydh.Tfbs.K562.Pol2.Std. (f) POLR3G signals from the dataset Sydh.Tfbs.K562.Pol3.Std. (g) RAD21 signals from the dataset Sydh.Tfbs.K562.Rad21.Std. (h) SMC3 signals from the dataset Sydh.Tfbs.K562.Smc3ab9263.Iggrab. (i) USF2 signals from the dataset Sydh.Tfbs.K562.Usf2.Std. Each dataset ID has the format <Data source>.<Experiment type>.<Cell line>.<Open chromatin method/histone modification/TF>.<Experiment details>. The dot in each box-and-whisker plot is the average value. Some outlier values are not shown. See Materials and methods for details.
Figure 6
Figure 6
Associating DRMs with potential target transcripts and TRFs involved. (a) Distance distribution between DRMs and potential target transcripts for four different types of gene expression experiments. (b) Distributions of the number of transcripts that each DRM potentially regulates; 10+ denotes 10 or more transcripts. (c) Distributions of the number of DRMs that each transcript is potentially regulated by; 15+ denotes 15 or more DRMs. (d) Distributions of the number of DRM-target transcript pairs with which each type of histone modification is involved.

References

    1. Vaquerizas JM, Kummerfeld SK, Teichmann SA, Luscombe N. A census of human transcription factors: function, expression and evolution. Nat Rev Genet. 2009;10:252–263. doi: 10.1038/nrg2538. - DOI - PubMed
    1. Maston GA, Evans SK, Green MR. Transcriptional regulatory elements in the human genome. Annu Rev Genomics Hum Genet. 2006;7:29–59. doi: 10.1146/annurev.genom.7.080505.115623. - DOI - PubMed
    1. Lettice LA, Heaney SJ, Purdie LA, Li L, de Beer P, Oostra BA, Goode D, Elgar G, Hill RE, de Graaff E. A long-range Shh enhancer regulates expression in the developing limb and fin and is associated with preaxial polydactyly. Hum Mol Genet. 2003;12:1725–1735. doi: 10.1093/hmg/ddg180. - DOI - PubMed
    1. Blackwood EM, Kadonaga JT. Going the distance: a current view of enhancer action. Science. 1998;281:60–63. - PubMed
    1. Schmid CD, Perier R, Praz V, Bucher P. EPD in its twentieth year: towards complete promoter coverage of selected model organisms. Nucleic Acids Res. 2006;34:D82–D85. doi: 10.1093/nar/gkj146. - DOI - PMC - PubMed

Publication types

Substances