. 2012 Sep 26;13(9):R50.
doi: 10.1186/gb-2012-13-9-r50.

Functional analysis of transcription factor binding sites in human promoters

Affiliations

Functional analysis of transcription factor binding sites in human promoters

Troy W Whitfield et al. Genome Biol. .

Abstract

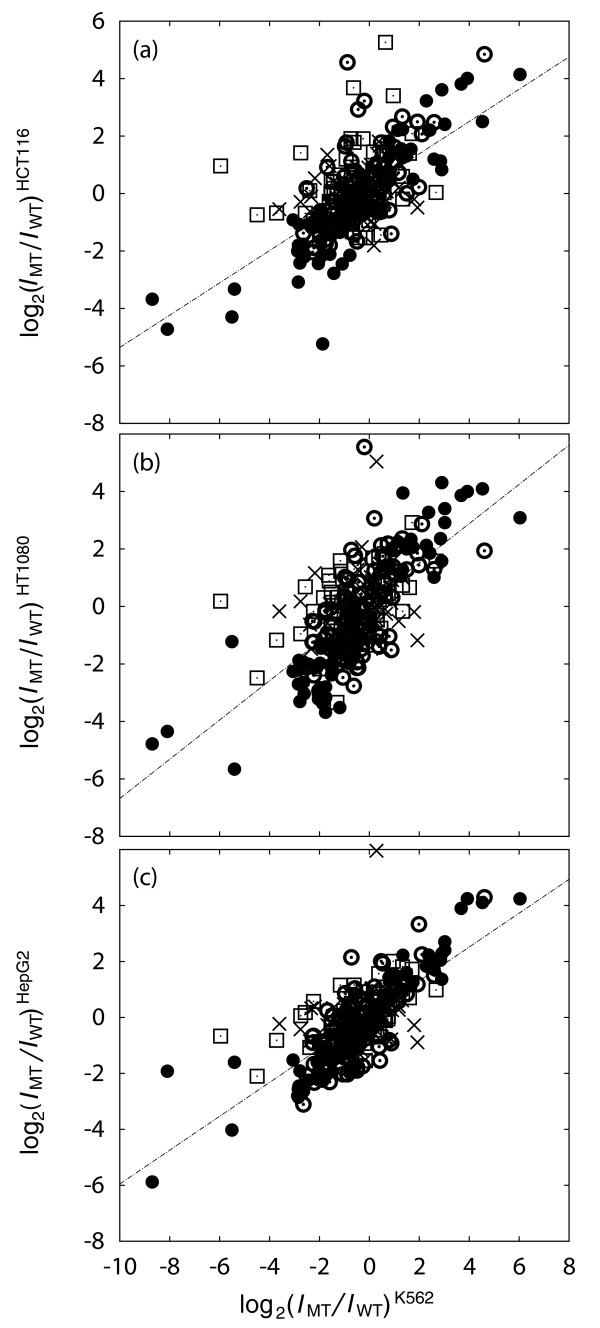
Background: The binding of transcription factors to specific locations in the genome is integral to the orchestration of transcriptional regulation in cells. To characterize transcription factor binding site function on a large scale, we predicted and mutagenized 455 binding sites in human promoters. We carried out functional tests on these sites in four different immortalized human cell lines using transient transfections with a luciferase reporter assay, primarily for the transcription factors CTCF, GABP, GATA2, E2F, STAT, and YY1.

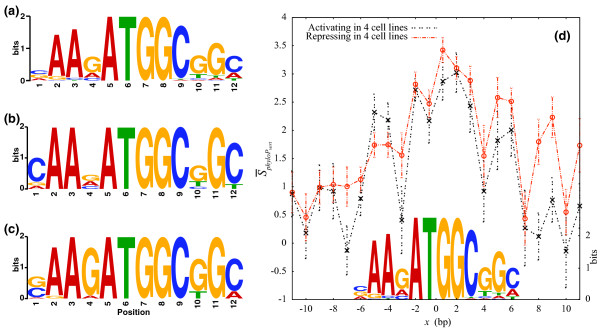
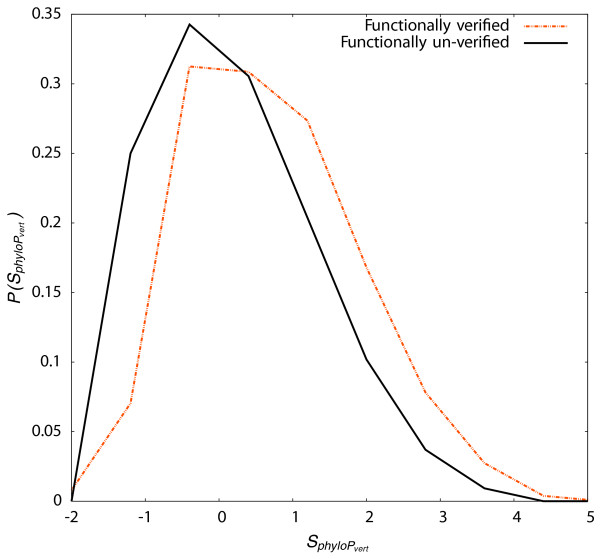
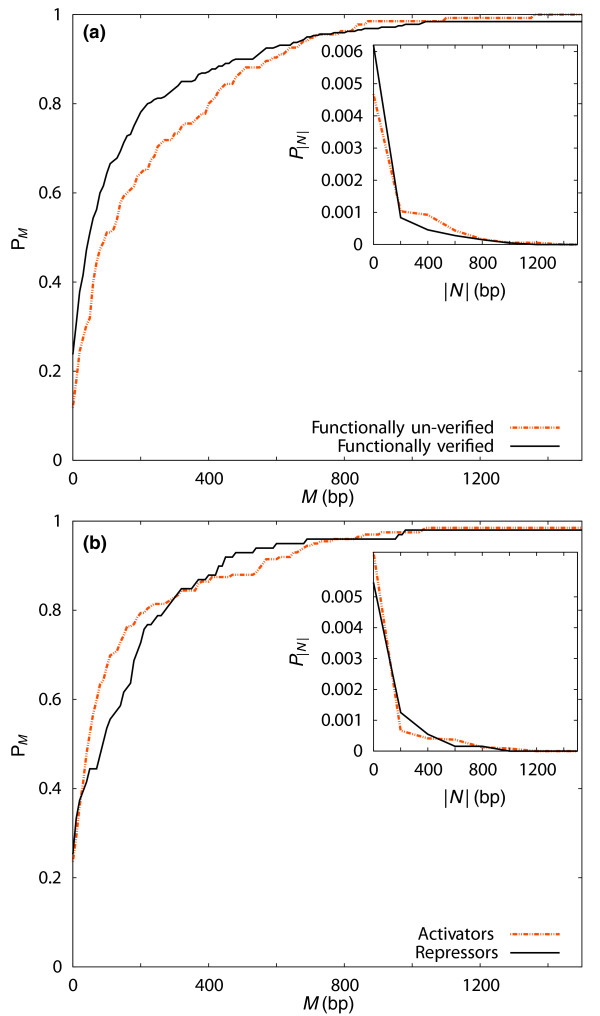
Results: In each cell line, between 36% and 49% of binding sites made a functional contribution to the promoter activity; the overall rate for observing function in any of the cell lines was 70%. Transcription factor binding resulted in transcriptional repression in more than a third of functional sites. When compared with predicted binding sites whose function was not experimentally verified, the functional binding sites had higher conservation and were located closer to transcriptional start sites (TSSs). Among functional sites, repressive sites tended to be located further from TSSs than were activating sites. Our data provide significant insight into the functional characteristics of YY1 binding sites, most notably the detection of distinct activating and repressing classes of YY1 binding sites. Repressing sites were located closer to, and often overlapped with, translational start sites and presented a distinctive variation on the canonical YY1 binding motif.

Conclusions: The genomic properties that we found to associate with functional TF binding sites on promoters -- conservation, TSS proximity, motifs and their variations -- point the way to improved accuracy in future TFBS predictions.


Figures

Figure 1
Figure 1
Pairwise scatter plots for luciferase signals. Plotted is |log2(IMT/IWT)|, where IMT and IWT are the mutant and wild-type normalized luminosities, respectively, in four cell lines (K562, HCT116, HT1080 and HepG2). Experiments plotted are those where TFBS function was validated in all four cell lines (bullet), three cell lines (open circle with middle dot), two cell lines (open square with middle dot) and one cell line (cross). The Spearman correlation coefficients for experiments carried out in K562 cells with those in HCT116 cells (a), HT1080 cells (b), and HepG2 cells (c) are 0.57, 0.64 and 0.65, respectively.
Figure 2
Figure 2
Characterization of functional YY1 binding sites. Sequence logo [102] for YY1 binding sites from (a) PWM and sites that are functionally (b) ubiquitously activating (9 BS) or (c) ubiquitously repressive (16 BS) in four human cell lines. In (d), we plot the mean vertebrate phyloP conservation score [90] around functional YY1 binding sites. The mean score, S ¯phyloPvert, was computed at each base for sites where the binding event ubiquitously activated (black line) or repressed (red line) transcription in all four cell lines. The position weight matrix that was used to predict YY1 binding sites is shown (scale on the right axis).
Figure 3
Figure 3
Conservation differs for functional classes of TF binding sites. Distributions of normalized vertebrate phyloP score, SphyloPvert . for TFBSs that were functionally verified in at least one cell line (dashed line) and for TFBSs that were not functionally verified in any cell line (solid line).
Figure 4
Figure 4
Using the distance to the TSS to distinguish between TF binding site classes. Binding sites that were functionally verified or not (a) and between activating and repressing TFBSs (b). Here, P|N| = P-N + PN is the probability of finding a validated TFBS within |N| base pairs of the transcription start site (inset). The cumulative probability, M=N=0MP|N|, is plotted in the main panels.

References

    1. Lemon B, Tjian R. Orchestrated response: a symphony of transcription factors for gene control. Genes Dev. 2000;14:2551–69. doi: 10.1101/gad.831000. - DOI - PubMed
    1. Butler J, Kadonaga J. The RNA polymerase II core promoter: a key component in the regulation of gene expression. Genes Dev. 2002;16:2583–2592. doi: 10.1101/gad.1026202. - DOI - PubMed
    1. Hannenhalli S. Eukaryotic transcription factor binding sites-modeling and integrative search methods. Bioinformatics. 2008;24:1325–31. doi: 10.1093/bioinformatics/btn198. - DOI - PubMed
    1. Zhou Q, Wong WH. CisModule: de novo discovery of cis-regulatory modules by hierarchical mixture modeling. Proc Natl Acad Sci USA. 2004;101:12114–9. doi: 10.1073/pnas.0402858101. - DOI - PMC - PubMed
    1. Zhu Z, Shendure J, Church GM. Discovering functional transcription-factor combinations in the human cell cycle. Genome Res. 2005;15:848–55. doi: 10.1101/gr.3394405. - DOI - PMC - PubMed

Publication types

Substances

LinkOut - more resources